Cancer Statistics in the United States: Key Facts, Trends, and What They Mean
Cancer statistics are more than large numbers. They help patients, families, clinicians, researchers, and public health teams understand where cancer is most common, which cancers cause the greatest burden, and how prevention, screening, diagnosis, and treatment are changing outcomes over time.
At Horizon Health Institute, we present cancer data in a clear, practical way so readers can understand the bigger picture without losing sight of the person behind every diagnosis.
Sources: American Cancer Society Cancer Facts & Figures 2026; National Cancer Institute SEER Cancer Stat Facts; CDC U.S. Cancer Statistics.
Why Cancer Statistics Matter
Cancer statistics help answer important public health questions: How many people are diagnosed each year? Which cancers are most common? Are death rates improving? Are some groups affected more than others? These answers guide screening recommendations, research funding, hospital planning, prevention campaigns, and patient education.
For individuals, statistics can also provide context. They do not predict exactly what will happen to one person, but they can show why early detection, accurate diagnosis, and evidence-based treatment planning are so important.

How Many People Are Diagnosed With Cancer in the U.S.?
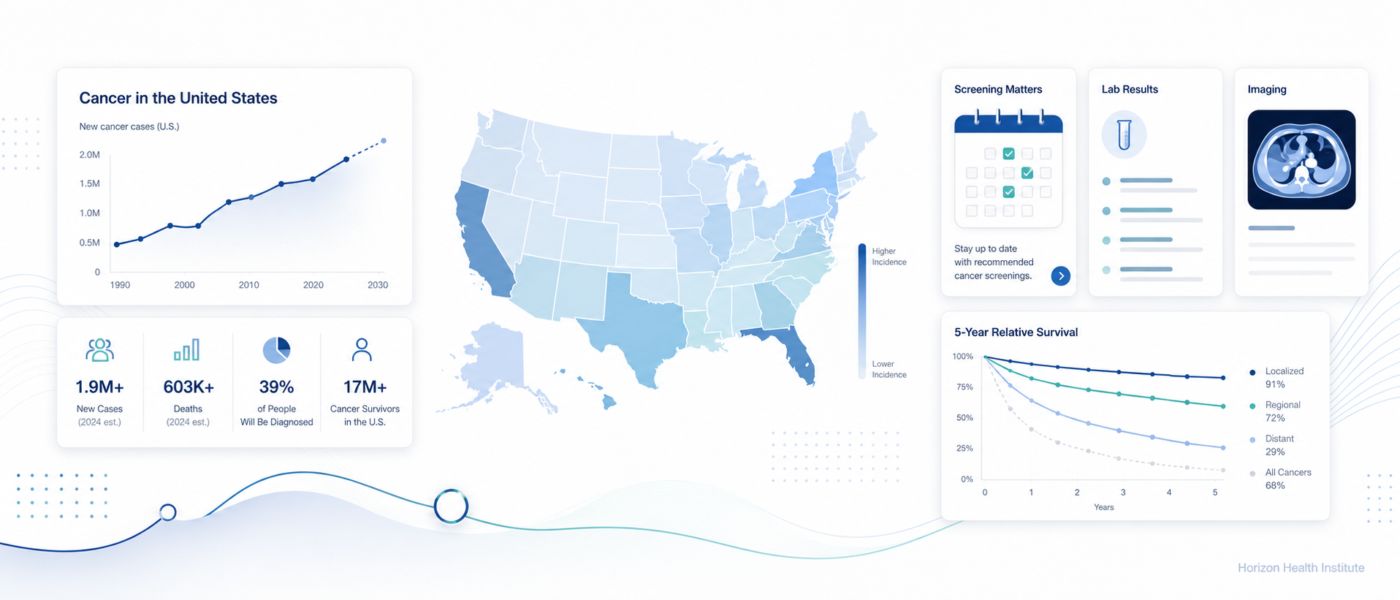
The American Cancer Society estimates that about 2,114,850 new cancer cases will be diagnosed in the United States in 2026. This number includes many different cancer types, from common cancers such as breast, prostate, lung, and colorectal cancer to less common blood, urinary, skin, and digestive system cancers.
The CDC’s U.S. Cancer Statistics program reports that the latest available incidence data show 1,851,238 new cancer cases were reported in the United States in 2022. Because national cancer registry data take time to collect, verify, and analyze, official reported data often lag behind current-year estimates.
| Statistic | Latest figure | What it means |
|---|---|---|
| Estimated new cancer cases | 2,114,850 in 2026 | Projected number of people expected to be diagnosed with cancer in the U.S. during the year. |
| Reported new cancer cases | 1,851,238 in 2022 | Confirmed cases from national cancer registry reporting, based on the latest complete CDC data. |
| Age-adjusted incidence rate | 450.7 per 100,000 people per year | A rate adjusted for age, allowing fairer comparison across populations with different age structures. |
Sources: American Cancer Society Cancer Facts & Figures 2026; CDC U.S. Cancer Statistics; National Cancer Institute SEER Cancer Stat Facts.
How Many People Die From Cancer Each Year?
Cancer remains one of the leading causes of death in the United States. The American Cancer Society estimates that about 626,140 people will die from cancer in the U.S. in 2026. CDC data show that 613,349 people died of cancer in 2023, the latest year for which national mortality data are available.
These numbers are sobering, but they do not tell the whole story. Cancer death rates have declined over time for many cancers because of lower smoking rates, earlier detection, improved surgery and radiation techniques, better systemic therapies, and more personalized treatment planning.
Important context
A high number of deaths does not always mean a cancer is the most commonly diagnosed. Some cancers are less common but more aggressive. Others are common but often detected early or treated successfully.
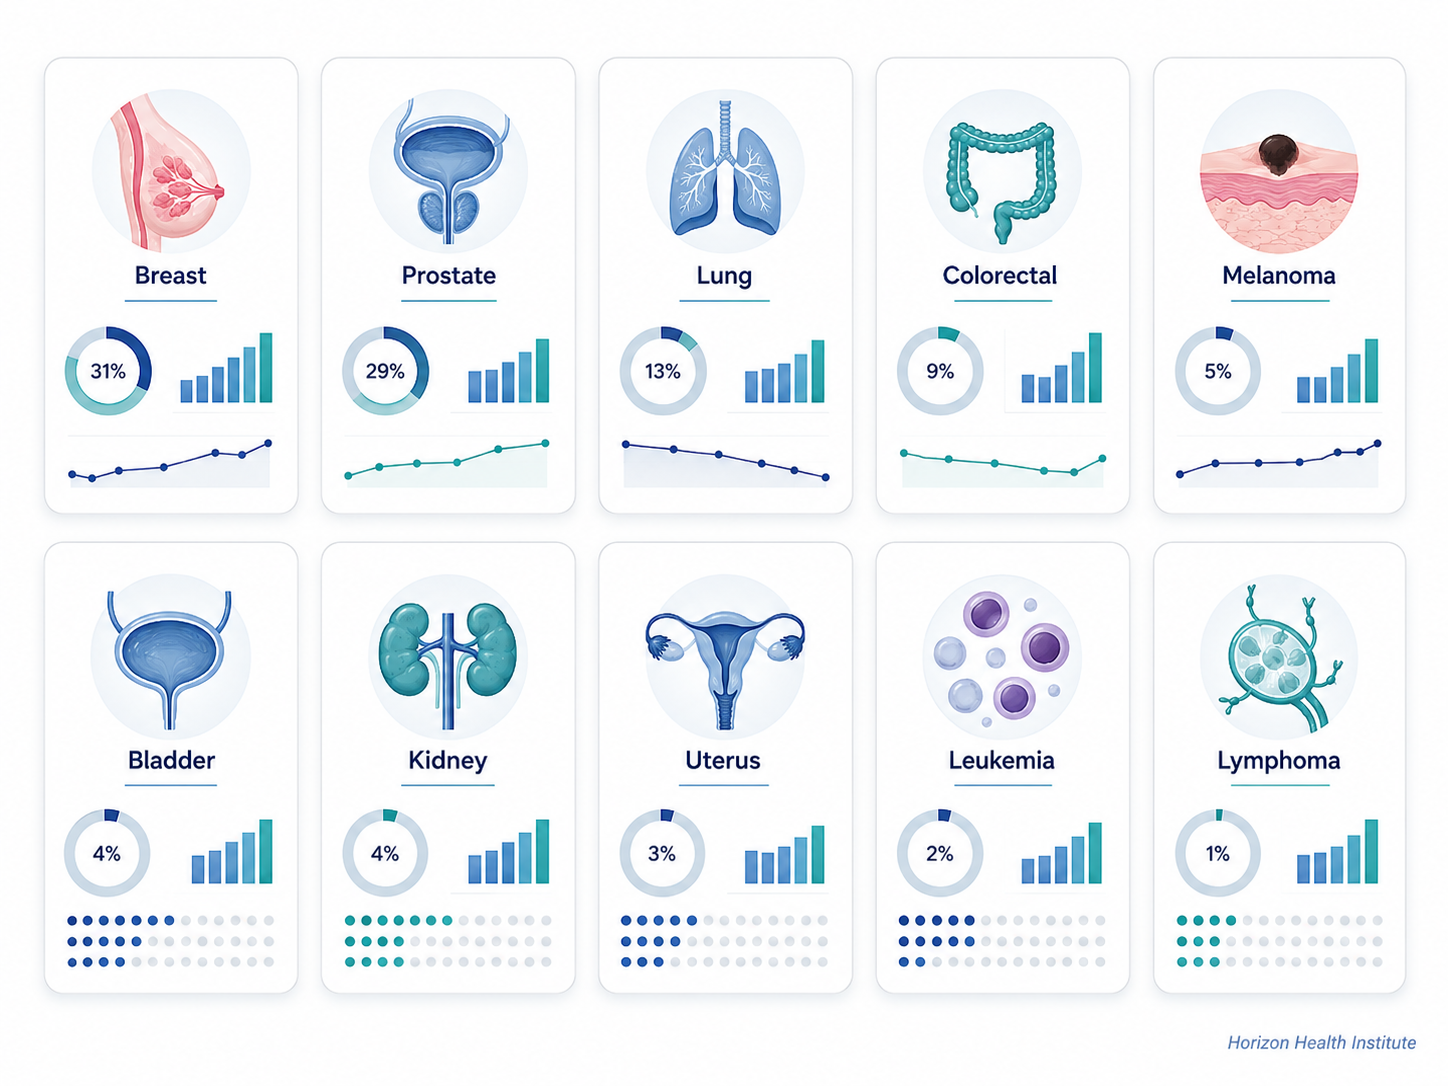
The Most Common Cancers in U.S. Adults
The most common cancers vary by sex, age, risk factors, screening patterns, and population group. In broad national estimates, breast cancer, prostate cancer, lung cancer, colorectal cancer, melanoma, bladder cancer, kidney cancer, uterine cancer, non-Hodgkin lymphoma, leukemia, and thyroid cancer are among the frequently diagnosed cancers in adults.
Lung and bronchus cancer remains the leading cause of cancer death in the United States. According to NCI/SEER estimates for 2026, lung and bronchus cancer is expected to cause about 124,990 deaths, followed by colorectal cancer and pancreatic cancer among the leading causes of cancer mortality.
| Cancer category | Why it matters | Modern medical role |
|---|---|---|
| Breast cancer | One of the most commonly diagnosed cancers in women. | Mammography, pathology, receptor testing, genetic risk assessment, and personalized treatment planning. |
| Prostate cancer | Very common in men, especially with aging. | PSA testing, MRI, biopsy, risk stratification, active surveillance, surgery, radiation, and systemic therapy when needed. |
| Lung cancer | Leading cause of cancer death in the U.S. | Low-dose CT screening for eligible high-risk adults, imaging, biopsy, biomarker testing, immunotherapy, and targeted therapy. |
| Colorectal cancer | A major cause of cancer illness and death, but often preventable through screening. | Colonoscopy, stool-based tests, polyp removal, pathology, staging scans, surgery, chemotherapy, and follow-up surveillance. |
Sources: American Cancer Society Cancer Facts & Figures 2026; National Cancer Institute SEER Cancer Stat Facts.
Are Cancer Survival Rates Improving?
Yes, overall cancer survival has improved substantially over the past several decades. The American Cancer Society reported that the five-year relative survival rate for all cancers combined reached 70% for people diagnosed during 2015–2021 in the United States.
Survival improvements reflect many factors working together: earlier detection, better imaging, more accurate pathology, safer surgery, improved radiation therapy, chemotherapy advances, immunotherapy, targeted therapy, biomarker testing, and more structured follow-up care.
What five-year relative survival means
Five-year relative survival compares people with cancer to people in the general population of the same age, sex, and race who do not have that cancer. It does not mean a person can only live five years, and it does not predict an individual outcome.
Why survival differs by cancer type
- Some cancers are often found early through screening.
- Some cancers grow slowly, while others are more aggressive.
- Some cancers have highly effective targeted or hormone-based treatments.
- Stage at diagnosis strongly affects treatment options and outcomes.
- Access to timely, high-quality care can influence survival.
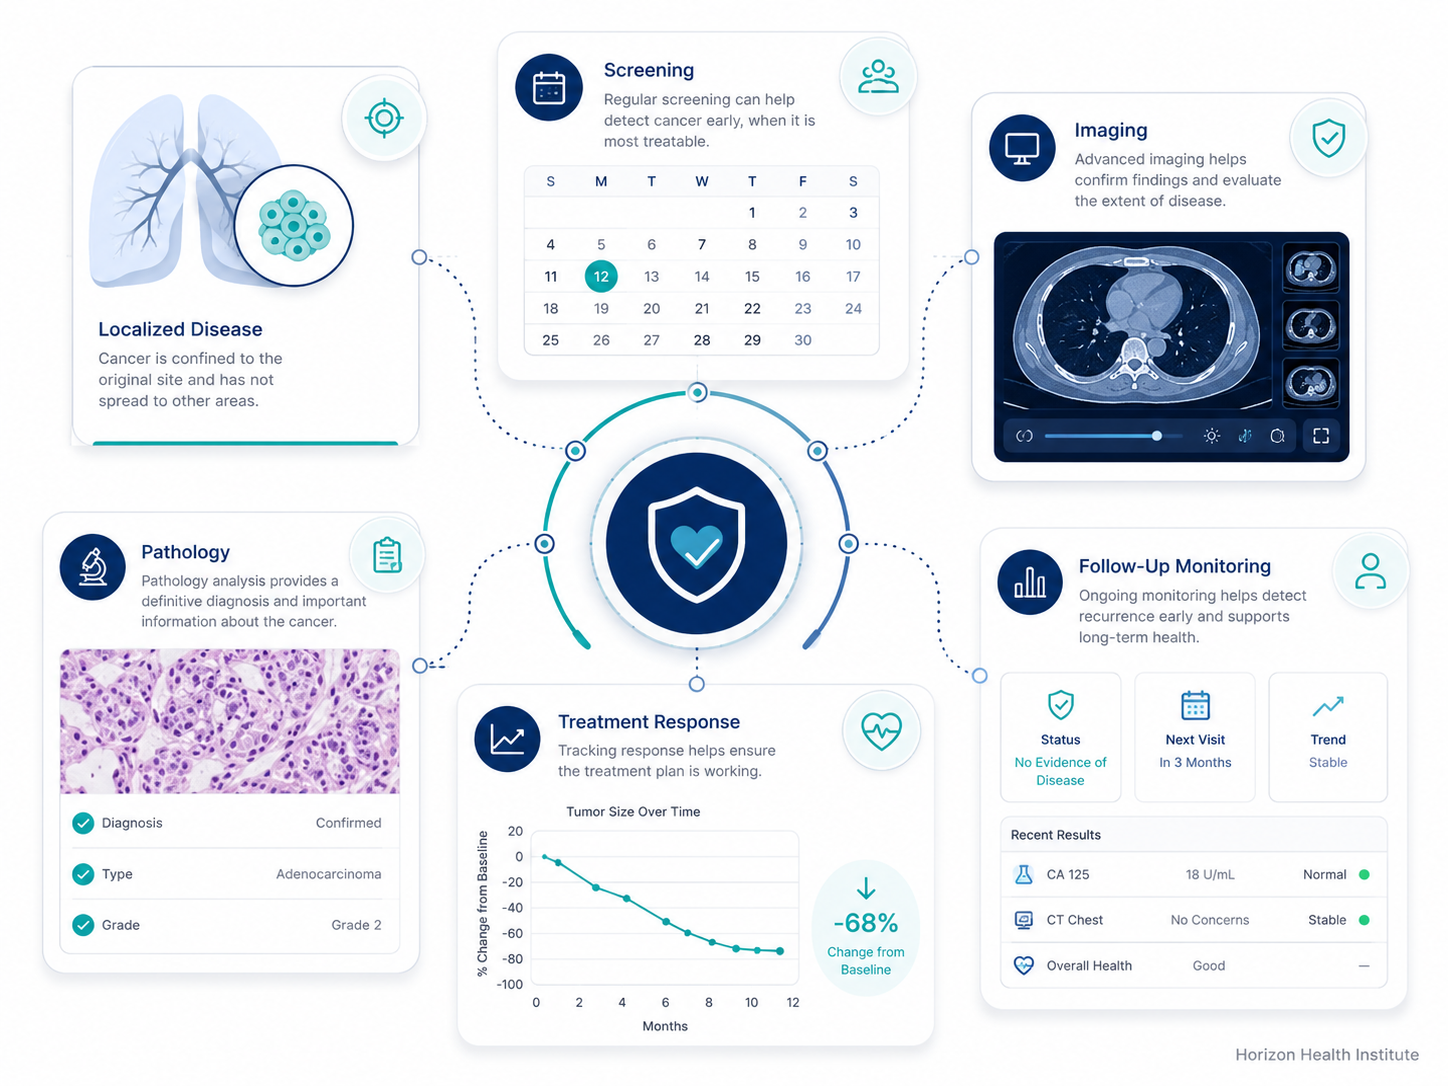
Why Early Detection Changes the Numbers
Cancer is often easier to treat when found at an earlier stage. Screening tests can detect certain cancers before symptoms appear, and in some cases they can find precancerous changes that can be removed before cancer develops.
Examples include mammography for breast cancer, colonoscopy or stool-based testing for colorectal cancer, Pap and HPV testing for cervical cancer, and low-dose CT screening for lung cancer in eligible high-risk adults. These tools do not prevent every cancer, but they can shift diagnosis toward earlier stages, where treatment may be more effective.
| Screening area | What it can do | Why follow-up matters |
|---|---|---|
| Breast cancer screening | May find breast cancer before a lump is felt. | Abnormal mammograms may need diagnostic imaging or biopsy. |
| Colorectal cancer screening | Can detect cancer early and may prevent cancer by finding removable polyps. | Positive stool tests usually require colonoscopy. |
| Cervical cancer screening | Can find HPV-related cell changes before cancer develops. | Abnormal results may need repeat testing or colposcopy. |
| Lung cancer screening | Low-dose CT can detect lung cancer earlier in eligible high-risk adults. | Small lung findings may need repeat imaging, specialist review, or biopsy. |
What Cancer Statistics Cannot Tell You
Cancer statistics describe groups of people, not one individual. A person’s outlook depends on many details, including cancer type, stage, tumor biology, genetic or molecular markers, overall health, treatment response, and access to specialized care.
This is why modern oncology relies on more than one number. Clinicians combine physical examination, imaging, laboratory testing, pathology, biomarker results, staging, patient goals, and follow-up monitoring to create a care plan that fits the person, not just the diagnosis.
Major Trends Behind Today’s Cancer Statistics
U.S. cancer statistics are shaped by several long-term trends. The population is aging, and cancer risk generally increases with age. At the same time, prevention, screening, and treatment have improved for many cancers. This creates a complex picture: more people may be diagnosed because the population is older, while death rates may decline for some cancers because care is better.
Trends that may increase cancer burden
- Aging of the population
- Obesity and metabolic risk factors
- Tobacco exposure, including past smoking history
- Alcohol-related cancer risk
- UV exposure and skin cancer risk
- Infection-related cancer risks, such as HPV and hepatitis viruses
- Delayed screening or delayed follow-up after abnormal results
Trends that may improve outcomes
- Lower smoking rates over time
- Vaccination against HPV and hepatitis B
- Better screening and earlier diagnosis
- More precise imaging and staging
- Improved pathology and molecular testing
- Targeted therapy, immunotherapy, and better supportive care
- Survivorship care and long-term monitoring
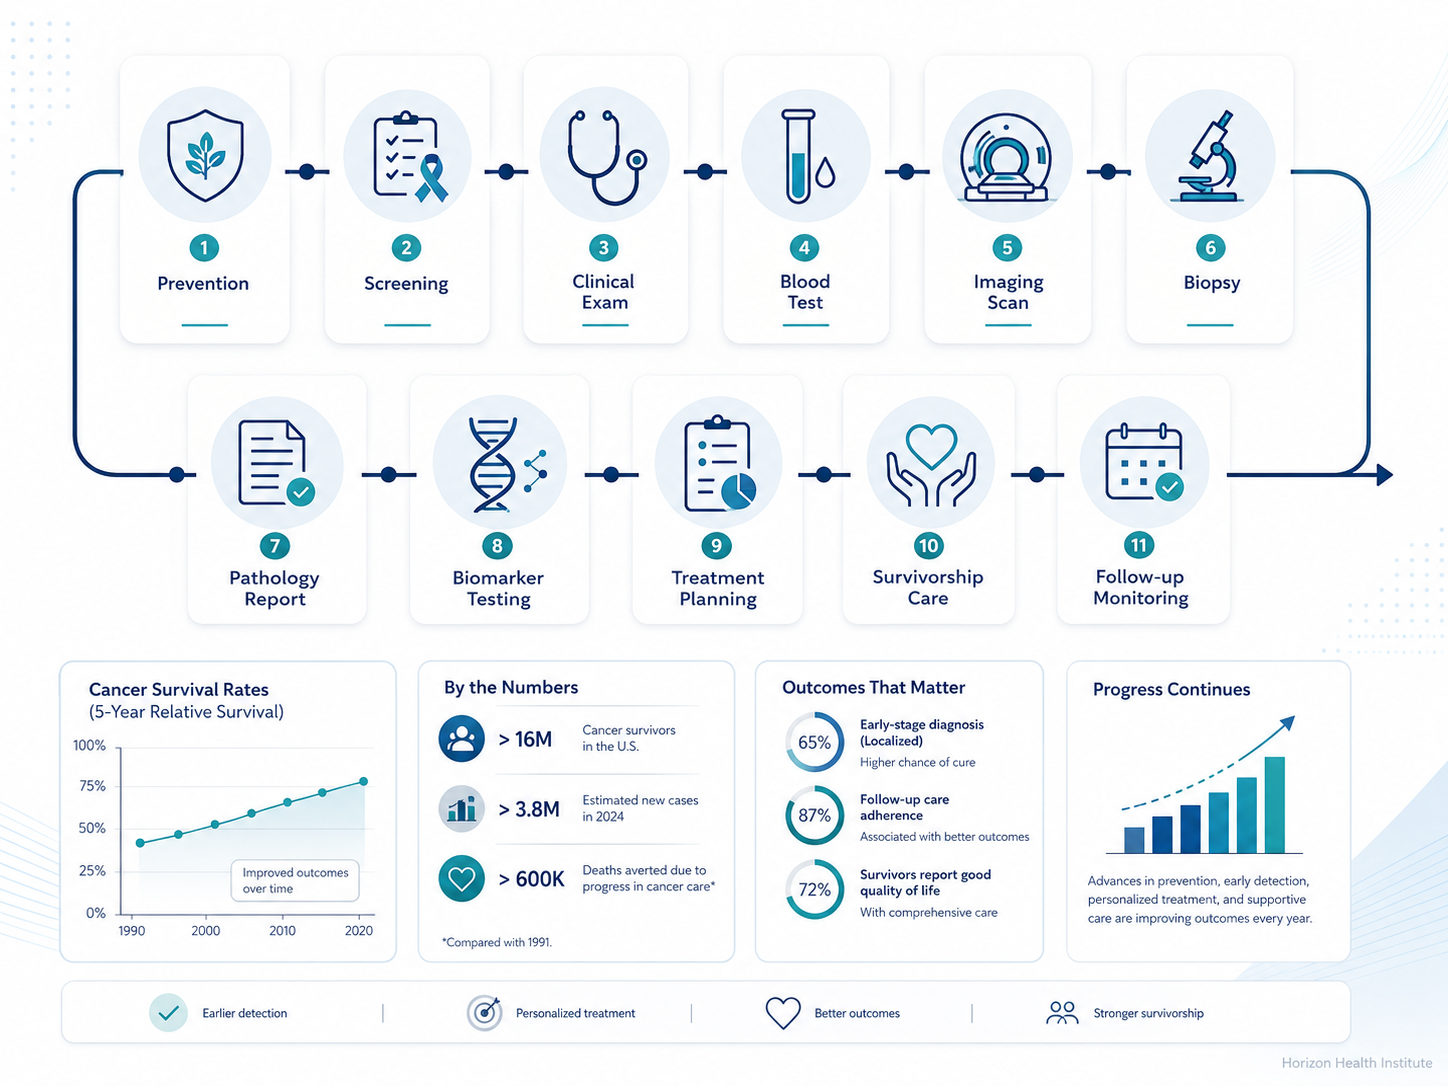
The Role of Modern Medicine in Cancer Data
Modern medicine has changed how cancer is found, classified, treated, and monitored. A cancer diagnosis today often involves a detailed pathway: symptoms or screening result, clinical evaluation, imaging, biopsy, pathology review, biomarker testing, staging, treatment planning, and follow-up.
These steps matter because two people with the same cancer name may have very different tumor biology. For example, lung cancer, breast cancer, colorectal cancer, and melanoma may be tested for molecular markers that can guide treatment decisions. In some cases, targeted therapy or immunotherapy may be considered based on those results.
Data becomes more useful when care becomes more precise
Cancer statistics show population-level trends, while modern diagnostic tools help clinicians understand the individual disease. Both are important: public health data guides prevention and screening, while clinical data guides personal treatment decisions.
What These Numbers Mean for Adults and Families
The most useful takeaway from cancer statistics is not fear. It is awareness. Many cancers are influenced by risk factors that can be reduced, and some can be detected earlier through screening. Even when cancer cannot be prevented, timely evaluation and accurate diagnosis can make a meaningful difference.
- Know which cancer screenings are recommended for your age, sex, risk factors, and family history.
- Do not ignore persistent symptoms, especially unexplained weight loss, unusual bleeding, a changing mole, a persistent cough, or a new lump.
- Follow up on abnormal screening results, imaging findings, or laboratory tests.
- Ask whether pathology, staging, or biomarker testing is needed to guide treatment planning.
- Keep a clear record of diagnosis, treatments, medications, scans, and follow-up appointments.
Trusted Sources for Cancer Statistics
Horizon Health Institute recommends using established public health and oncology sources when reviewing cancer statistics. Reliable sources update data regularly, explain methods, and distinguish between current-year estimates and confirmed registry data.
| Source | Best used for |
|---|---|
| American Cancer Society | Annual Cancer Facts & Figures, estimated new cases, estimated deaths, survival trends, and cancer prevention resources. |
| CDC U.S. Cancer Statistics | Official reported cancer incidence and death data from national surveillance systems. |
| National Cancer Institute SEER Program | Cancer incidence, mortality, survival, lifetime risk, and cancer-specific data tables. |
| NIH and FDA | Research updates, cancer biology, treatment science, drug approvals, and clinical trial information. |
Key Takeaway
Cancer statistics show both the scale of the challenge and the progress being made. In the United States, millions of people are diagnosed with cancer each year, and hundreds of thousands die from the disease. At the same time, survival has improved for many cancers because of prevention, screening, earlier diagnosis, more accurate testing, better treatments, and long-term follow-up care.
Understanding the numbers can help adults make informed decisions, ask better questions, and recognize the value of prevention, timely evaluation, and evidence-based cancer care.
References
- American Cancer Society. Cancer Facts & Figures 2026.
- American Cancer Society. Annual Cancer Statistics Report 2026.
- Centers for Disease Control and Prevention. U.S. Cancer Statistics Data and Statistics.
- National Cancer Institute. SEER Cancer Stat Facts: Cancer of Any Site.
- National Cancer Institute. SEER Cancer Stat Facts: Common Cancer Sites.