
You go for a physical, get a blood test, and receive a report showing your total cholesterol is 218 mg/dL. The reference range says below 200 is desirable. You are in the “borderline high” category. But what does that actually mean — and what should you do with the number?
Total cholesterol is the most commonly reported lipid value, and it is also among the most easily misunderstood. The number represents the sum of all cholesterol carried in your blood across multiple lipoprotein types — but those components have very different effects on cardiovascular health. A total cholesterol of 218 could reflect a worrying pattern or a completely healthy one depending on what is driving it.
What Total Cholesterol Actually Measures
Total cholesterol is a mathematical sum of the cholesterol found in all lipoprotein particles:
Total Cholesterol = LDL Cholesterol + HDL Cholesterol + VLDL Cholesterol
VLDL is estimated in standard labs as triglycerides ÷ 5. LDL is also typically calculated rather than directly measured, using the Friedewald equation: LDL = Total Cholesterol − HDL − (Triglycerides ÷ 5).
The problem with the sum is that it treats all components as equivalent — but LDL and HDL have opposite effects on cardiovascular health. LDL deposits cholesterol in artery walls and promotes plaque buildup. HDL removes cholesterol from artery walls and returns it to the liver. A high total cholesterol driven by high HDL reflects a very different health situation than the same number driven by high LDL.
Consider two people: Person A has total cholesterol 240, LDL 155, HDL 75. Person B has total cholesterol 190, LDL 155, HDL 25. Person A’s cholesterol is technically “high” by standard categories. Person B’s falls in the “desirable” range. Yet Person B’s cardiovascular risk is substantially worse — their LDL is identical but their protective HDL is dramatically lower. Total cholesterol viewed in isolation can actively mislead.
Total Cholesterol Reference Ranges
Borderline high: 200–239 mg/dL
High: ≥240 mg/dL
These categories from the National Cholesterol Education Program are useful for population-level screening — identifying who needs a more complete evaluation — but they are not the final word on cardiovascular risk. “Borderline high” does not automatically mean you need medication. “Desirable” does not guarantee you are protected. Both statements depend on what is driving the number and what your other risk factors look like.
Why Total Cholesterol Is Often Misleading on Its Own
The exercise paradox illustrates this clearly. Regular aerobic exercise consistently raises HDL cholesterol — often by 5 to 15 percent in regular exercisers. Because HDL contributes to total cholesterol, exercisers sometimes see their total cholesterol rise modestly as their HDL increases. This is not a problem — it reflects an improved lipid profile. But someone looking only at the total would conclude they were getting worse.
High total cholesterol driven by familial hypercholesterolemia (FH) — affecting approximately 1 in 250 people — produces total cholesterol of 300 to 500 mg/dL regardless of diet. Here the elevation is dangerous, but only because the driver is pathologically elevated LDL. The same total number in someone with high HDL would signal something entirely different.
The American Heart Association and ACC/AHA guidelines consistently state that total cholesterol alone is insufficient for cardiovascular risk assessment. A full lipid panel — including LDL, HDL, and triglycerides — is required for meaningful clinical interpretation. To understand the complete test, see our guide on what is a lipid panel.
What Total Cholesterol to HDL Ratio Means
The total cholesterol to HDL ratio (TC/HDL) adds substantial interpretive value. To calculate: divide total cholesterol by HDL. Example: Total cholesterol 240 ÷ HDL 60 = ratio of 4.0.
3.5–4.4 — Below average risk
4.5–5.0 — Average risk
>5.0 — Elevated cardiovascular risk
>6.0 — High risk
The TC/HDL ratio captures the balance between atherogenic and protective cholesterol. A person with total cholesterol of 240 and HDL of 60 has a ratio of 4.0 — below average risk. A person with total cholesterol of 190 and HDL of 30 has a ratio of 6.3 — high risk. The ratio makes explicit what the total alone conceals. Women typically have lower TC/HDL ratios than men of the same age because women tend to have higher HDL levels.
Non-HDL Cholesterol — A Better Measure
Non-HDL cholesterol equals total cholesterol minus HDL and captures all cholesterol in potentially harmful lipoproteins: LDL, VLDL, IDL, and Lp(a). No additional testing is required — both values come from a standard lipid panel.
How to calculate: Non-HDL = Total Cholesterol − HDL. Example: TC 230, HDL 55 → Non-HDL = 175 mg/dL.
Near optimal: 130–159 mg/dL
Borderline high: 160–189 mg/dL
High: 190–219 mg/dL
Very high: ≥220 mg/dL
Current ACC/AHA guidelines recommend non-HDL as a treatment target alongside LDL, especially in people with metabolic syndrome, diabetes, or elevated triglycerides — situations where LDL calculation can underestimate risk. Non-HDL also captures Lp(a), an independent genetic cardiovascular risk factor that LDL measurement misses.
What Affects Total Cholesterol?
Age and sex. Women generally have lower total cholesterol before menopause — estrogen promotes HDL and LDL clearance. After menopause, LDL rises and the gap with men narrows. By age 65, women on average have higher total cholesterol than men. For a foundation-level explanation of cholesterol biology, see our article on what is cholesterol.
Diet. Dietary saturated fat is the most powerful nutritional driver of LDL — the most common cause of elevated total cholesterol in people without genetic conditions. Trans fats raise LDL and lower HDL simultaneously. Soluble fiber and plant sterols modestly lower LDL.
Genetics. Familial hypercholesterolemia causes LDL receptor dysfunction, producing total cholesterol of 300 to 500+ mg/dL regardless of diet. FH is significantly underdiagnosed. Anyone with persistently high total cholesterol despite lifestyle changes — especially with family history of early heart disease — should discuss FH evaluation with a physician.
Physical activity. Aerobic exercise primarily raises HDL, which may modestly raise total cholesterol — a benign increase that should not be interpreted negatively.
Medications and conditions. Statins reduce total cholesterol 25 to 45 percent by lowering LDL. Hypothyroidism raises total cholesterol — treating it often normalizes cholesterol without specific lipid therapy. Seasonal variation adds 5 to 10 percent to winter readings compared to summer.
How Your Risk Level Changes the Interpretation
The clinical significance of total cholesterol depends enormously on individual risk. Modern cardiovascular risk assessment uses the ACC/AHA 10-year ASCVD risk calculator, combining cholesterol values with age, sex, blood pressure, diabetes status, and smoking to estimate the 10-year probability of a heart attack or stroke.
For a low-risk person (10-year ASCVD risk below 7.5 percent), lifestyle modification is the primary recommendation even if total cholesterol or LDL is borderline-high. For a high-risk person (10-year risk above 20 percent) or someone with existing cardiovascular disease, statins are typically recommended when LDL exceeds guideline targets regardless of how total cholesterol is categorized.
This is why a total cholesterol of 220 mg/dL means very different things for a 35-year-old woman with no other risk factors versus a 60-year-old man with type 2 diabetes, hypertension, and a family history of early heart disease. The number is the same; the clinical action is entirely different. For context on how LDL specifically drives risk, see our article on LDL vs HDL cholesterol.
Seasonal Variation and Biological Variability
Two underappreciated sources of variability affect cholesterol measurements.
Seasonal variation. Total cholesterol and LDL are measurably 5 to 10 percent higher in winter months than summer. A test in January may read 10 to 15 mg/dL higher than one taken in July in the same person with no change in actual metabolic health — reflecting seasonal patterns in diet, activity, and possibly temperature physiology.
Biological variability. Even under identical conditions, cholesterol values fluctuate. The within-person coefficient of variation for LDL is approximately 5 to 8 percent. For someone with average LDL of 130 mg/dL, repeat measurements could legitimately range from 117 to 143 mg/dL without any real change in health. This is why major treatment decisions should not be made from a single measurement, particularly for borderline values — repeat testing after lifestyle changes and trending over time is more informative than reacting to any one data point.
When Total Cholesterol Prompts Action
Who should be tested. The AHA recommends cholesterol testing starting at age 20, with repeat testing every four to six years for those with desirable results and no additional risk factors. People with known risk factors benefit from more frequent monitoring. Children with family history of early cardiovascular disease should be tested between ages 9 and 11.
When borderline numbers warrant lifestyle change. Total cholesterol of 200 to 239 mg/dL in an otherwise healthy person without cardiovascular disease appropriately prompts lifestyle evaluation — reviewing saturated fat and sugar intake, increasing physical activity, addressing weight if relevant, and quitting smoking. These changes directly improve both total cholesterol and the underlying lipid composition. For what specifically raises cholesterol, see our article on causes of high cholesterol.
When medication should be considered. Statins are recommended when the 10-year ASCVD risk exceeds 7.5 percent with elevated LDL (above 70 to 100 mg/dL depending on risk tier), when LDL ≥190 mg/dL regardless of risk, or when LDL exceeds targets despite adequate lifestyle modification. Total cholesterol itself is not the statin trigger — LDL and calculated risk are.
Advanced testing. For people with borderline risk, additional tests can refine assessment: ApoB (counts atherogenic particles directly), Lp(a) (independent genetic risk factor), and coronary artery calcium (CAC) score (measures actual arterial plaque deposits). These tests can reveal significant risk when standard cholesterol numbers appear borderline.
A total cholesterol result gives you a starting point, not a conclusion. The numbers that matter most are LDL, HDL, non-HDL, and the TC/HDL ratio. When you receive your results, look at the full panel. Ask about your 10-year ASCVD risk. Focus on the changes with the strongest evidence: reducing saturated fat and refined carbohydrates, increasing soluble fiber, exercising regularly. These changes improve the entire metabolic picture that determines actual cardiovascular risk. For more on interpreting the complete test, see our article on triglycerides and heart health.
Understanding Your Results in the Context of Your Health History
Total cholesterol numbers do not exist in a vacuum — they interact with the rest of your health history in ways that can completely change what action is appropriate. Two people with identical total cholesterol values can require very different responses based on the clinical context surrounding that number.
Prior cardiovascular events. Someone who has already had a heart attack, stroke, or has been diagnosed with coronary artery disease or peripheral artery disease is in the “very high risk” category for future cardiovascular events. For these individuals, current guidelines recommend aggressive LDL reduction — targeting LDL below 70 mg/dL and in some guidelines below 55 mg/dL. Even if their total cholesterol is only mildly elevated, the existing disease burden makes the risk from any residual LDL significantly higher than in someone without prior events.
Diabetes. Type 2 diabetes and type 1 diabetes are classified as high-risk conditions for cardiovascular disease even in the absence of prior events. The mechanisms are multiple: elevated blood sugar glycates LDL particles making them more atherogenic, impairs endothelial function, promotes the small dense LDL phenotype, and is often accompanied by hypertension and obesity. Adults with diabetes and additional risk factors have LDL targets comparable to people with established coronary artery disease, meaning their total cholesterol and LDL results are interpreted through a much stricter lens.
Hypertension. Elevated blood pressure damages arterial endothelium, increasing the permeability that allows LDL to penetrate artery walls and initiate plaque formation. Someone with both high total cholesterol and uncontrolled hypertension faces compounded risk that is greater than either factor alone. This is why blood pressure appears as an input in the ASCVD risk calculator alongside cholesterol values — the combination matters, not just the individual numbers.
Family history of premature cardiovascular disease. A first-degree relative who had a heart attack before age 55 (for men) or 65 (for women) is a substantial independent risk factor that increases the weight placed on cholesterol values. Someone with a strong family history may warrant earlier statin consideration at borderline LDL levels that would not trigger treatment in a person without that history.
Making Sense of the Full Lipid Panel Report
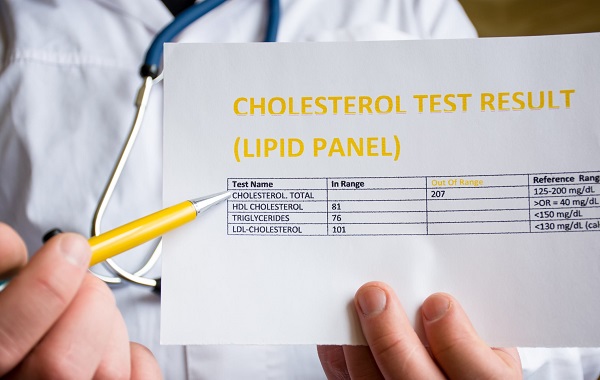
When you receive a cholesterol panel report, it typically lists each value in a table with the reference ranges. Here is how to read it systematically rather than just looking at whether numbers fall inside or outside the reference range.
Step 1: Look at LDL first. LDL is the primary driver of atherosclerosis and the primary treatment target. If LDL is clearly in the optimal range (below 100 mg/dL), the risk from cholesterol is generally low unless other lipid abnormalities are pronounced. If LDL is elevated, proceed to context.
Step 2: Check HDL. Low HDL (below 40 mg/dL for men, below 50 mg/dL for women) is an independent risk factor that worsens the risk from any given LDL level. High HDL (60 mg/dL or above) is a negative risk factor — it provides some offset against elevated LDL, though it does not eliminate risk.
Step 3: Calculate non-HDL. Subtract HDL from total cholesterol. This gives you a more comprehensive picture of atherogenic particle burden than LDL alone. Non-HDL above 190 mg/dL warrants attention even if individual values seem borderline.
Step 4: Calculate the ratio. Divide total cholesterol by HDL. A ratio above 5.0 signals elevated risk even when the total cholesterol number appears manageable in absolute terms.
Step 5: Look at triglycerides. Elevated triglycerides (above 150 mg/dL) indicate metabolic dysfunction that typically accompanies an unfavorable LDL particle composition shift toward small dense particles. High triglycerides with low HDL is the lipid pattern most associated with insulin resistance and metabolic syndrome.
Step 6: Consider your overall risk. With the full panel in hand, calculate or ask your doctor to calculate your 10-year ASCVD risk. This places the cholesterol numbers into the context of your age, sex, blood pressure, and other risk factors — giving you a probability that is far more actionable than a single cholesterol number.
What the Total Cholesterol Number Cannot Tell You
Even after working through the full lipid panel, certain aspects of cardiovascular risk remain invisible to standard testing.
Lp(a) — Lipoprotein(a). This is a modified LDL particle with an additional protein attached that makes it more atherogenic and also promotes clot formation. Lp(a) levels are almost entirely determined by genetics and are minimally affected by diet, exercise, or standard lipid-lowering drugs. Approximately 20 percent of the global population has elevated Lp(a). Current guidelines recommend measuring Lp(a) at least once in adult life — it can explain why some people develop cardiovascular disease despite otherwise normal cholesterol values.
ApoB. Standard LDL cholesterol measures the amount of cholesterol in LDL particles, not the number of particles. Two people with the same LDL-C can have very different numbers of LDL particles — the person with more particles has greater cardiovascular risk. ApoB directly counts atherogenic particles (each LDL, VLDL, and IDL particle carries exactly one ApoB-100 molecule) and can detect high particle counts in people whose LDL-C appears normal.
Coronary artery calcium (CAC) score. A CT-based test that directly measures calcified plaque deposits in coronary arteries. A CAC score of zero indicates minimal atherosclerosis regardless of cholesterol levels and identifies people who may safely defer statin therapy. A high CAC score indicates established plaque independent of current cholesterol values. CAC is particularly useful for resolving uncertainty in people with borderline 10-year cardiovascular risk — it can either confirm the need for treatment or provide reassurance that defers it.
Endothelial function and inflammation. High-sensitivity C-reactive protein (hsCRP) measures systemic inflammation, which is an independent cardiovascular risk factor. The JUPITER trial demonstrated that people with normal LDL but elevated hsCRP derived cardiovascular benefit from statins — suggesting that inflammatory risk not captured by cholesterol values contributes meaningfully to cardiac events. This is one reason why some people with “normal” cholesterol levels still develop heart disease.
Common Misconceptions About Total Cholesterol
“My total cholesterol is fine, so I don’t need to worry.” As illustrated throughout this article, total cholesterol in the desirable range does not ensure cardiovascular safety if HDL is very low, LDL is borderline, or other risk factors are present. The 35-year-old who had a heart attack with a “normal” total cholesterol often had a combination of low HDL, marginally elevated LDL, elevated Lp(a), or elevated inflammatory markers that standard screening missed.
“I need to get my total cholesterol as low as possible.” Very low cholesterol is not the goal — appropriate LDL reduction is. Total cholesterol includes HDL, which is beneficial. Statin therapy aims to lower LDL specifically, not eliminate cholesterol from the body. Cholesterol is essential for cell membrane construction, hormone synthesis, and vitamin D production. The target is optimized balance, not minimization.
“If my cholesterol was fine last year, it’s still fine.” Cholesterol values change over time with age, dietary changes, weight fluctuations, medication changes, and health conditions. A normal value five years ago is not a guarantee of current normal values, particularly after major life changes — significant weight gain or loss, new medications, thyroid problems, or pregnancy. Consistent periodic monitoring is more informative than a single historical normal result.
“My cholesterol went up slightly — I need to start medication immediately.” A modest single-measurement increase is often within the range of biological and seasonal variability. Unless the value is dramatically elevated or the clinical context is high-risk, most guidelines recommend lifestyle modification as the first response, with repeat testing in three to six months before escalating to pharmacological treatment for borderline elevations.
The Practical Takeaway on Total Cholesterol
Understanding total cholesterol is ultimately about moving past the headline number and developing a more complete picture of lipid health. Here is a summary of what to take away from this guide.
Total cholesterol is useful as a first-pass screening value — it identifies who needs a fuller evaluation. But it should never be the endpoint of interpretation. A total cholesterol of 230 driven by high HDL and modest LDL is not the same clinical situation as a total cholesterol of 200 driven by high LDL and very low HDL, even though the first number technically exceeds the “desirable” threshold and the second does not.
The four most informative calculations from a standard lipid panel are: LDL (the primary atherogenic driver), non-HDL (the most comprehensive single measure of atherogenic burden), the total cholesterol to HDL ratio (the best single summary of cholesterol balance), and triglycerides (a window into metabolic health and VLDL burden). Total cholesterol itself contributes to two of these calculations — the ratio and non-HDL — but it is the derived metrics rather than the sum that matter most for clinical decision-making.
When you receive cholesterol results, ask three questions: What is my LDL, and what is the appropriate target for someone at my risk level? What is my non-HDL, and does it suggest residual atherogenic burden beyond LDL? What is my 10-year ASCVD risk, and what does it indicate about whether lifestyle modification alone is sufficient or whether medication should be discussed?
The goal of cholesterol management is not to achieve a particular number on a lab report — it is to reduce the probability of a future cardiovascular event. Total cholesterol is the starting point in that assessment. The clinical conversation that follows — accounting for your full lipid profile, your risk factors, your age, and your personal circumstances — is where the number becomes actionable.
This is one of the clearest explanations of total cholesterol: how to understand your I have found. I especially valued the explanation of why these recommendations exist, not just what they are. Keep up this kind of thorough health journalism — it genuinely helps patients like me.
Thank you for covering total cholesterol: how to understand your so thoroughly without being overly technical. The article answered questions I didn’t even know I had until I started reading. Forwarding this to others in my support group who are dealing with similar issues.
Finally a resource that explains total cholesterol: how to understand your in plain language. I have tried following advice from several sources but this is the most consistent with what my specialist told me. This gave me real confidence going into my next specialist appointment.
I never fully understood total cholesterol: how to understand your until I read this. The specific numbers and thresholds mentioned are exactly what I needed to understand my results. Keep up this kind of thorough health journalism — it genuinely helps patients like me.
Came across this while researching total cholesterol: how to understand your for a family member. I appreciate that the article is careful about distinguishing between what is known and what is still being researched. Thank you for making complex medical information accessible without dumbing it down.
I have been reading about total cholesterol: how to understand your for weeks and this is the most thorough guide I found. I have tried following advice from several sources but this is most consistent with what my specialist told me. This is going into my health folder that I bring to every doctor’s visit.