
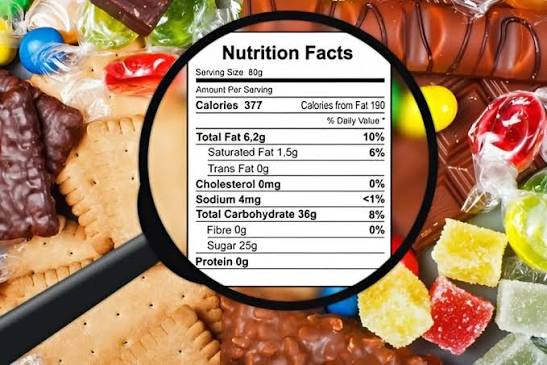
Reading food labels for blood sugar management is one of the most practical and immediately actionable skills an adult with prediabetes or diabetes can develop. The Nutrition Facts panel on packaged foods — redesigned in 2020 by the FDA to emphasize the information most relevant to metabolic health — contains everything needed to evaluate how a food will affect blood glucose, how it compares to alternatives, and whether a serving size is appropriate for blood sugar management goals. Yet surveys consistently show that fewer than 30% of adults with diabetes report regularly reading food labels before purchasing packaged foods, and that even those who do read labels often focus on calories or total fat rather than the carbohydrate and sugar information most directly relevant to blood glucose management. Developing a fluent, efficient approach to label reading — knowing exactly which numbers to look for, what they mean for blood sugar, and how to apply them at the grocery store — transforms food packaging from an opaque marketing surface into a transparent metabolic tool.
The average packaged food contains 2.5 times the carbohydrate that its serving size suggests when typical real-world consumption amounts are used. Checking the serving size before reading any other label number is the single most important label-reading habit for blood sugar management.
The Three Numbers That Matter Most for Blood Sugar
Of all the information on the Nutrition Facts panel, three lines are most directly relevant to blood sugar management for adults with prediabetes or diabetes: Total Carbohydrate, Dietary Fiber, and Added Sugars. Understanding what each represents and how to use it provides sufficient label-reading capability for the vast majority of blood sugar management decisions:
- Total Carbohydrate: This is the most critical number for blood sugar management. Total carbohydrate includes all forms of carbohydrate in the food: starches, sugars (both naturally occurring and added), and sugar alcohols. It is the total carbohydrate gram count — not sugar alone, not “net carbs” — that determines how much glucose ultimately arrives in the bloodstream from a serving of that food. Adults managing blood sugar through carbohydrate control need to read Total Carbohydrate per serving and multiply by the number of servings they actually consume to determine the total carbohydrate load of their meal contribution.
- Dietary Fiber: Fiber is a form of carbohydrate that is not digested and absorbed as glucose, meaning it contributes to Total Carbohydrate on the label but does not raise blood sugar. High-fiber foods produce slower, lower postprandial glucose responses than low-fiber foods with the same Total Carbohydrate content, because fiber slows glucose absorption. Adults who track “net carbs” (Total Carbohydrate minus Dietary Fiber) are approximating the digestible carbohydrate that will actually raise blood sugar — a useful concept, though FDA-regulated labels report Total Carbohydrate as the definitive figure. Foods with 3 or more grams of fiber per serving are generally considered good fiber sources that partially buffer the blood sugar impact of their carbohydrate content.
- Added Sugars: The 2020 FDA label redesign added a specific “Added Sugars” line that distinguishes between sugars naturally present in food (from fruit, dairy) and sugars added during manufacturing. Added sugars are metabolically unfavorable for blood sugar management: they provide glucose or fructose with no accompanying fiber or micronutrients to slow absorption, produce rapid blood glucose spikes, and contribute to hepatic fat accumulation and insulin resistance with excessive consumption. The American Heart Association recommends limiting added sugars to fewer than 25 grams per day for women and 36 grams for men — limits that are easily exceeded by single servings of many packaged foods (a single 12-oz regular soda contains 39 grams of added sugar).
Serving Size: The Label Number You Must Check First
All numbers on the Nutrition Facts panel — including Total Carbohydrate, Fiber, Added Sugars, and everything else — are reported per serving, and serving sizes on packaged food labels frequently differ dramatically from typical consumption amounts. Failing to check the serving size before reading carbohydrate content is the most common and consequential food label reading error for blood sugar management: adults may check that a product contains “30 grams of carbohydrate” and assume that represents their consumption, while the serving size is only half a cup and they habitually consume two cups — meaning their actual carbohydrate consumption from that food is 120 grams, four times what they believed. The 2020 FDA label redesign updated serving sizes to more closely reflect amounts people actually consume (for example, updating ice cream servings from half a cup to two-thirds of a cup, and updating beverages of 15–24 oz from 8 oz to the full container), which partially corrected the previous underrepresentation of realistic consumption. However, significant discrepancies between stated serving sizes and real-world consumption remain across many food categories — particularly cereals (stated serving 3/4 cup, typical consumption 2+ cups), chips and snack foods (stated serving 1 oz or about 15 chips, typical consumption 3–5 oz), and pasta and rice (stated serving ½ cup cooked, typical restaurant/home portion 2–3 cups cooked). For adults managing blood sugar, the practical habit is: first identify the serving size, then determine how many servings you will actually consume, then multiply all label numbers by that serving multiplier to determine actual carbohydrate, fiber, and sugar intake. This two-step process — serving check, then carbohydrate multiplication — takes less than 10 seconds per food item and prevents the systematic carbohydrate underestimation that undermines blood sugar management for adults who read labels without checking serving sizes. The FDA’s guide to understanding the Nutrition Facts label provides authoritative explanations of all label components and the regulatory basis for each figure, and the CDC’s nutrition label reading guide offers accessible explanations oriented toward chronic disease prevention.
Hidden Sugars: Ingredient Lists and Misleading Marketing Terms
While the Nutrition Facts panel provides the quantitative data most relevant to blood sugar management, the ingredient list reveals qualitative information about sugar sources that the label’s aggregate numbers can obscure. Food manufacturers use over 60 different names for added sugars in ingredient lists — including corn syrup, high-fructose corn syrup, dextrose, maltose, sucrose, cane juice, agave nectar, honey, coconut sugar, maltodextrin, barley malt, and fruit juice concentrate — allowing products to list multiple sugar sources individually, each appearing lower on the ingredient list than if all sugars were combined under a single name. This labeling structure can make a product appear lower in sugar than it is: a granola bar with corn syrup, honey, and cane sugar as the third, fifth, and seventh ingredients has a substantial combined added sugar content that is fractured across three ingredient list entries and may not be immediately apparent to a consumer focused on the front-of-package claims. For adults reading food labels for blood sugar management, three practical ingredient list checks supplement the Nutrition Facts panel data effectively: first, checking whether any form of sugar appears in the first three ingredients (high position indicates high sugar content by weight); second, counting the number of different sugar names in the ingredient list (products with 3 or more sugar aliases often have higher combined added sugar content than their individual positions suggest); and third, being specifically alert to “low-fat” and “reduced-fat” products, which frequently compensate for fat removal with added sugars that raise Total Carbohydrate and added sugar content significantly compared to full-fat versions. Products marketed as “natural,” “organic,” “no artificial sweeteners,” or “made with real fruit” are not regulated to indicate lower sugar or carbohydrate content — organic cane sugar and conventional cane sugar have identical blood sugar effects, and “made with real fruit” products frequently use fruit juice concentrate (a high-added-sugar ingredient) rather than whole fruit. Our guide on diabetes prevention: a practical guide covers the dietary principles within which smart label reading plays an essential supporting role, and our guide on how to lower Type 2 diabetes risk provides the broader dietary evidence base for adults seeking to reduce their metabolic risk through improved food selection. The NIDDK’s guidance on diet for diabetes management supports label reading as a practical component of the nutritional self-management skills recommended for all adults managing blood sugar.
Glycemic Index vs. Nutrition Label: What the Label Doesn’t Tell You
An important limitation of the standard Nutrition Facts panel is that it reports Total Carbohydrate and Added Sugars but does not indicate the glycemic index (GI) or glycemic load (GL) of a food — the measures of how quickly and how sharply a food raises blood glucose relative to a reference. Two foods with identical Total Carbohydrate content per serving can produce dramatically different postprandial glucose responses: 30 grams of carbohydrate from steel-cut oats produces a much slower, lower glucose peak than 30 grams of carbohydrate from instant oatmeal or white bread, because the processing and physical structure of the food affect how rapidly enzymes can access and digest the starch. The nutrition label alone cannot capture this difference. Supplementing food label reading with working knowledge of glycemic index for commonly consumed foods — or using resources like the ADA’s guide to glycemic index and diabetes or the University of Sydney’s GI database — helps adults with blood sugar concerns select not just how many carbohydrates to consume but which forms of carbohydrate minimize glucose spikes even at equivalent total quantities. Key practical generalizations: foods that are more processed, more finely ground, more cooked, or more concentrated tend to have higher glycemic indices than their whole, intact, or minimally processed equivalents; adding fat, protein, or fiber to any carbohydrate source lowers its effective glycemic response in the context of a mixed meal; and cold or reheated cooked starches (cold rice, cooled pasta) have lower glycemic responses than freshly cooked equivalents due to resistant starch formation. For reading food labels for blood sugar purposes, checking ingredient lists for degree of processing (whole grain listed first vs. refined flour listed first) provides a useful proxy for glycemic quality that complements the quantitative carbohydrate data on the Nutrition Facts panel.
Decoding Common Label Claims That Affect Blood Sugar
Front-of-package marketing claims frequently mislead adults managing blood sugar by implying metabolic benefits that the Nutrition Facts panel does not support. Understanding what specific label claims legally do and do not mean — and when they warrant scrutiny of the actual panel data — protects against marketing-driven food selection errors that worsen blood sugar control:
- “Sugar-free”: Legally means fewer than 0.5 grams of sugar per serving, but does NOT mean carbohydrate-free or low-calorie. Sugar-free products frequently contain other carbohydrates (starches, fiber, maltodextrin) that still raise blood sugar, and many use sugar alcohols (sorbitol, maltitol, xylitol) that appear in Total Carbohydrate and have partial blood sugar impact — approximately half the glucose effect of equivalent sugar. Always check Total Carbohydrate on sugar-free products, not just the “sugar-free” front label.
- “Reduced sugar” or “less sugar”: Means the product contains at least 25% less sugar than the original version — but the original may have contained very high amounts, making the “reduced” version still high in sugar. A product with 20 grams of added sugar per serving is 25% “reduced” from an original with 27 grams — both are high in added sugar from a blood sugar management perspective.
- “Whole grain” or “made with whole grains”: “Made with whole grains” requires no minimum whole grain content — a product can contain primarily refined flour with a small amount of whole grain and legally make this claim. “100% whole grain” or “whole grain” as the first ingredient on the ingredient list are the meaningful indicators that the product has intact grain fiber structure that lowers glycemic response. Check the ingredient list: the first grain ingredient should be “whole” (whole wheat, whole oats, whole rye) rather than just “wheat flour” or “enriched flour.”
- “Low glycemic” or “diabetic-friendly”: These terms are not regulated by the FDA and carry no standardized definition. Products carrying these claims may or may not have Total Carbohydrate contents or glycemic profiles that support blood sugar management — always verify using the Nutrition Facts panel rather than relying on the unregulated front-panel claim.
- “No added sugars”: Means no sugars were added during processing, but the food may still be high in naturally occurring sugars (fruit-based products, plain yogurt with lactose, 100% fruit juice) that raise blood sugar. 100% fruit juice contains 24–36 grams of naturally occurring sugar per 8-oz glass — producing blood sugar effects nearly identical to sugar-sweetened beverages, despite no added sugars — because juice lacks the fiber and cell structure of whole fruit that attenuates glucose absorption.
Developing label-reading proficiency for blood sugar management ultimately requires combining three information sources: the Nutrition Facts panel for Total Carbohydrate, Fiber, and Added Sugars per actual serving consumed; the ingredient list for ingredient quality, sugar alias identification, and grain processing level; and working knowledge of glycemic index to interpret whether the carbohydrate quantity on the label will produce a fast or slow glucose response. This three-layer approach to reading food labels for blood sugar takes approximately 30–60 seconds per product and becomes faster with practice as category-level knowledge accumulates — allowing efficient label reading even during grocery shopping under time pressure. Our guide on portion control for blood sugar support provides the serving size management complement to label reading, and our guide on stress management and blood sugar addresses how stress-related cognitive impairment can undermine the label-reading habits that adults have developed during lower-stress periods — making stress management a supportive condition for consistent application of food literacy skills.
Building a Label-Reading Habit at the Grocery Store
The most effective label-reading approach for sustained blood sugar improvement is not analyzing every label at the grocery store indefinitely — a time-consuming practice that creates decision fatigue — but rather using initial label reading to build a personal inventory of “approved” products in each food category, then defaulting to those selections for routine purchases without re-reading. This one-time categorization approach works as follows: during an initial “label audit” shopping trip (or across several routine shopping trips), systematically compare labels across competing products in each relevant category — bread, yogurt, cereals, crackers, sauces, frozen foods — identifying the options with the lowest Total Carbohydrate per realistic serving, highest fiber content, and lowest added sugar within the category. Record the approved products by name or photograph the labels. In subsequent shopping trips, simply select the pre-identified approved products without re-reading labels, unless a “new and improved formulation” notice triggers a label check for any carbohydrate content changes. This habit-building approach concentrates the cognitive effort of label reading in the initial setup phase, then leverages the resulting product knowledge as a low-effort reference for ongoing food selection. Periodic label re-checks (every 6–12 months) catch manufacturer reformulations that change carbohydrate or sugar content without obvious packaging changes — a common practice that can silently increase the carbohydrate content of a product the consumer considers safe based on historical label reading. Adults who build this label-reading habit consistently in conjunction with the portion control strategies described in our guide on portion control for blood sugar support and the meal timing principles covered in our guide on healthy meal timing for blood sugar create a comprehensive, evidence-based dietary management framework that addresses carbohydrate quality, quantity, and timing simultaneously — the three dietary variables with the greatest combined impact on daily glucose control and long-term diabetes risk.
Applying Label Reading to Specific High-Risk Food Categories
While the principles of reading food labels for blood sugar management apply universally across packaged foods, several specific food categories deserve particular attention because they frequently contain unexpected or underestimated carbohydrate loads that catch blood sugar-conscious adults off guard:
- Flavored yogurts: Plain Greek yogurt is a high-protein, moderate-carbohydrate food (approximately 7–9 grams of naturally occurring lactose per serving) that is metabolically favorable for blood sugar management. Flavored yogurts — including “light,” “low-fat,” and “fruit-on-the-bottom” varieties — can contain 20–38 grams of total sugar per serving from added sugars and fruit preparations, making them metabolically equivalent to desserts from a glucose response perspective. Always check Total Carbohydrate and Added Sugars on flavored yogurt labels; choose products with 10 grams or fewer of Total Carbohydrate per serving when possible.
- Pasta sauces and condiments: Tomato-based pasta sauces frequently contain 8–15 grams of added sugar per half-cup serving — a serving size that is typically half the amount applied to a standard portion of pasta. Combined with the large pasta carbohydrate load, the hidden sugar in pasta sauce meaningfully amplifies the postprandial glucose response of a pasta meal. Selecting pasta sauces with fewer than 4 grams of added sugar per serving is feasible across most product categories. Condiments including ketchup (4 grams of added sugar per tablespoon), teriyaki sauce (6–10 grams per tablespoon), and barbecue sauce (12–16 grams per 2 tablespoons) contribute significant added sugar at tablespoon-scale quantities that are easily overlooked.
- Breakfast cereals: Even “healthy” breakfast cereals — granola, bran cereals, multigrain cereals — frequently contain 25–45 grams of Total Carbohydrate per stated serving with 10–20 grams of added sugar, while stated serving sizes (3/4 cup or 1 oz) are substantially smaller than typical bowl portions (1.5–3 cups). Checking the per-serving carbohydrate content and then multiplying by actual bowl size reveals that a large bowl of even a “heart-healthy” cereal can deliver 60–90 grams of carbohydrate — far exceeding the 45-gram per-meal target for blood sugar management.
- Protein bars and “healthy” snack bars: Products marketed as high-protein or nutritious alternatives to candy bars frequently contain 20–40 grams of carbohydrate per bar with 10–20 grams of added or sugar alcohol-derived sweeteners. Many use sugar alcohols (maltitol in particular) that produce substantial blood glucose effects despite being subtracted in “net carb” marketing calculations. Reading the actual Total Carbohydrate figure rather than the prominently marketed “net carbs” figure prevents systematic carbohydrate underestimation with these products.
Developing category-specific knowledge of the foods most likely to contain hidden or underestimated carbohydrate allows adults managing blood sugar to focus their label-reading attention most efficiently on the products where scrutiny produces the greatest protective benefit. Combined with the daily carbohydrate management strategies covered in our guides on portion control for blood sugar support and diabetes prevention: a practical guide, fluent label reading empowers adults to make food selections that align with their metabolic goals regardless of the marketing environment designed to undermine informed decision-making.
Sources: U.S. Food and Drug Administration — how to understand and use the Nutrition Facts label; Centers for Disease Control and Prevention — reading nutrition labels for healthy weight; National Institute of Diabetes and Digestive and Kidney Diseases (NIDDK) — diet and eating for diabetes; American Diabetes Association — carbohydrate counting and food label guidance; clinical research on food label literacy and dietary behavior in adults with diabetes and prediabetes.
This breakdown of reading food labels for blood sugar is exactly what patients need before a specialist appointment. The article answered questions I didn’t even know I had until I started reading. Shared this with three friends who are dealing with related issues. Very useful resource.
Finally a resource that explains reading food labels for blood sugar in plain language. I appreciate that the article is careful about distinguishing between what is known and what is still being researched. I wish I had found this article earlier — would have saved a lot of confusion.
Thank you for covering reading food labels for blood sugar so thoroughly without being overly technical. The connection between lifestyle choices and long-term outcomes is explained clearly here. I wish I had found this article earlier — would have saved a lot of confusion.