
Cholesterol numbers by risk level are not fixed thresholds that apply equally to everyone. The same LDL value — say, 120 mg/dL — is acceptable for a healthy 30-year-old with no risk factors and potentially too high for a 60-year-old who has already had a heart attack. Modern cardiovascular guidelines replaced the old one-size-fits-all approach with a risk-stratified framework: LDL targets, treatment thresholds, and the interpretation of “concerning” numbers all shift based on where an individual falls on the cardiovascular risk spectrum.
Understanding how your specific numbers map onto your risk level is one of the most practically valuable things a person can know about their own cholesterol results.
Why Cholesterol Numbers Must Be Interpreted by Risk Level
Two patients with identical LDL values of 145 mg/dL occupy very different clinical situations:
Patient A is 35 years old, non-smoking, non-diabetic, blood pressure normal, HDL of 62 mg/dL, no family history of premature cardiovascular disease. Their 10-year cardiovascular risk is approximately 2 to 3 percent. Their LDL of 145 mg/dL calls for dietary optimization and re-testing in 1 to 2 years.
Patient B is 62 years old, has type 2 diabetes, takes blood pressure medication, has an HDL of 38 mg/dL, and has a father who had a heart attack at age 54. Their 10-year ASCVD risk calculates to approximately 22 percent. The same LDL of 145 mg/dL in this patient is far above their guideline-recommended target (less than 70 mg/dL given their risk level) and warrants statin therapy.
The cholesterol number is the same. The clinical significance is completely different. The ACC/AHA 2019 guidelines calculate 10-year cardiovascular risk using the Pooled Cohort Equations — incorporating age, sex, race, total cholesterol, HDL, systolic blood pressure, diabetes, and smoking history. This calculated risk, combined with “risk enhancers,” forms the basis for individualized treatment decisions.
LDL Cholesterol Numbers by Risk Level — The Full Framework
Very High Risk — LDL target less than 55 mg/dL: Established ASCVD plus multiple major ASCVD events, or one major event plus multiple high-risk conditions (FH, diabetes, hypertension, CKD stages 3–4, smoking, heart failure). Evidence from FOURIER and ODYSSEY OUTCOMES trials shows continued cardiovascular benefit at LDL levels well below 70 mg/dL.
High Risk — LDL target less than 70 mg/dL: All patients with established clinical ASCVD (prior MI, stable angina, coronary revascularization, TIA, ischemic stroke, peripheral arterial disease) who do not meet very-high-risk criteria. Also: adults with LDL ≥190 mg/dL, which strongly suggests familial hypercholesterolemia.
Borderline to Intermediate Risk — LDL target less than 100 mg/dL: Adults with 10-year ASCVD risk 7.5 to 19.9 percent. Statin therapy is appropriate when LDL is persistently above 70–100 mg/dL and risk enhancers are present.
Low Risk — LDL below 130 mg/dL generally acceptable: Adults with 10-year risk below 5 percent, no risk enhancers, no prior cardiovascular events. LDL values of 100 to 129 mg/dL in this group warrant lifestyle optimization rather than medication.
HDL Cholesterol — What High and Low Numbers Mean
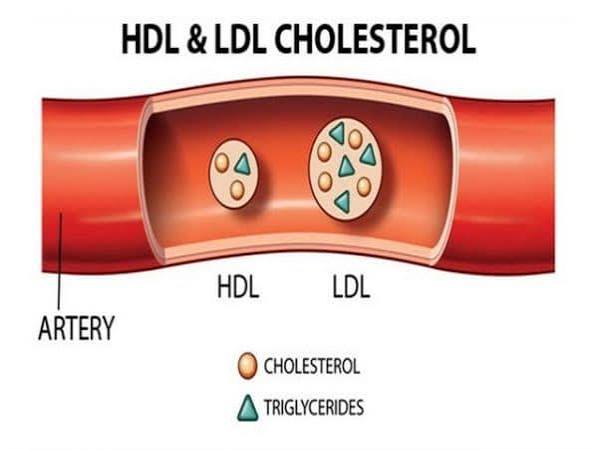
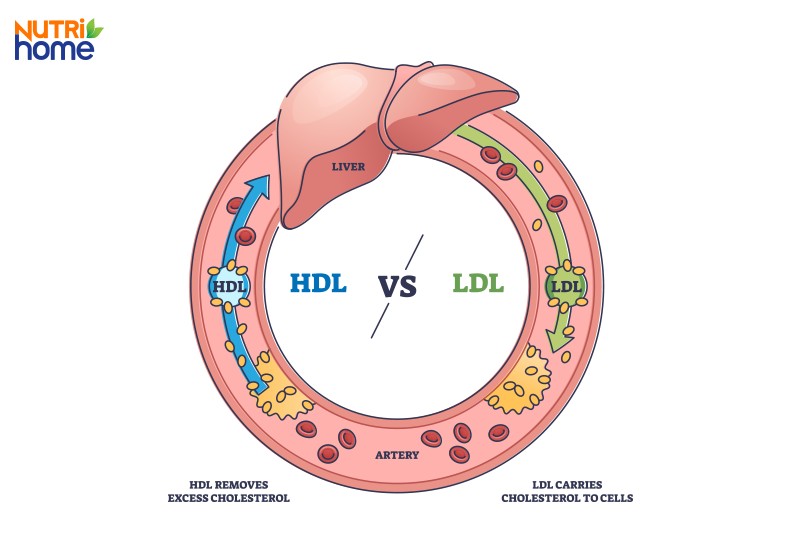
HDL cholesterol facilitates reverse cholesterol transport: removing cholesterol from arterial walls and returning it to the liver. Low HDL thresholds: below 40 mg/dL in men and below 50 mg/dL in women are independent cardiovascular risk factors. HDL of 60 mg/dL or above counts as a negative risk factor in the Framingham model, reducing calculated risk.
Despite the observed association between high HDL and low cardiovascular risk, clinical trials of drugs designed to raise HDL pharmacologically have been largely disappointing. The ILLUMINATE trial (torcetrapib), dal-OUTCOMES (dalcetrapib), and HPS2-THRIVE (niacin/laropiprant) all failed to reduce cardiovascular events despite significant HDL increases. Contemporary guidelines focus on LDL reduction as the primary lipid target, with HDL monitored as a risk indicator rather than a treatment target.
In practice, HDL is modifiable through lifestyle — aerobic exercise raises HDL 3 to 6 percent, smoking cessation can raise it 4 to 8 mg/dL, and weight loss contributes modestly. These lifestyle effects benefit cardiovascular health primarily through their combined effect on LDL, triglycerides, and systemic inflammation, not just the HDL number itself.
Triglyceride Numbers and What They Signal
Triglycerides are transported in VLDL particles and, at elevated levels, in VLDL remnants that are increasingly recognized as atherogenic. Elevated triglycerides also correlate with metabolic syndrome and insulin resistance.
Classification: Normal: below 150 mg/dL | Borderline high: 150–199 mg/dL (lifestyle intervention warranted) | High: 200–499 mg/dL (clinically significant; evaluate secondary causes) | Very high: ≥500 mg/dL (acute pancreatitis risk; urgent treatment required).
Common secondary causes: type 2 diabetes/insulin resistance (most common), obesity, alcohol, hypothyroidism, CKD, and medications including corticosteroids, oral estrogen, retinoids, and some antipsychotics. Treating underlying causes often normalizes triglycerides without lipid-specific medication.
The triglyceride:HDL ratio (TG÷HDL, using mg/dL values) above 3.0 is associated with insulin resistance and elevated LDL particle number even when LDL-C appears normal — making it a practical marker of metabolic risk beyond what the LDL value alone reveals.
Non-HDL Cholesterol — A Better Number Than Total Cholesterol
Non-HDL cholesterol (total cholesterol minus HDL) captures all atherogenic lipoproteins — LDL plus VLDL plus IDL remnants — making it more comprehensive than LDL alone, particularly when triglycerides are elevated. Non-HDL targets: below 130 mg/dL is optimal (corresponding to LDL below 100); non-HDL ≥190 mg/dL is a risk enhancer in ACC/AHA 2019. When triglycerides exceed 200 mg/dL, the Friedewald equation used to calculate LDL becomes inaccurate — non-HDL or directly measured LDL should be used instead.
Cholesterol Numbers by Risk Level — Who Defines “High Risk”?
Established ASCVD — always high or very high risk: Anyone with documented heart attack, stroke, coronary artery disease, coronary revascularization, peripheral arterial disease, or aortic aneurysm is in secondary prevention. They are definitionally high risk or very high risk.
LDL ≥190 mg/dL — high risk by lipid value alone: Strongly suggests familial hypercholesterolemia; warrants high-intensity statin regardless of age or calculated risk.
Diabetes mellitus (age 40–75): Diabetes pushes treatment decisions toward statin initiation. If 10-year risk exceeds 20 percent or multiple additional risk factors are present, treat as high risk with LDL target below 70 mg/dL.
Primary prevention with 10-year risk 7.5–19.9% and risk enhancers:
- Family history of premature ASCVD (first-degree relative, under 55 for men, under 65 for women)
- hsCRP ≥2.0 mg/L
- LDL ≥160 mg/dL or non-HDL ≥190 mg/dL
- ApoB ≥130 mg/dL
- Ankle-brachial index below 0.9
- Lp(a) ≥50 mg/dL
- Metabolic syndrome
- Chronic kidney disease (GFR 15–59)
- Inflammatory conditions (RA, psoriasis, HIV on ART)
- History of preeclampsia or premature menopause
When the risk picture remains uncertain, a coronary artery calcium (CAC) score can reclassify: CAC = 0 supports deferring statins; CAC ≥100 or ≥75th percentile for age/sex supports initiating therapy.
When Cholesterol Numbers Call for Action — vs. Monitoring Only
Monitor without medication (lifestyle optimization): LDL below 130 mg/dL in low-risk adults; triglycerides 150–199 mg/dL responding to dietary changes; low HDL in otherwise low-risk individuals (lifestyle is the primary intervention).
Medication discussion warranted: LDL persistently above 100 mg/dL in intermediate-risk adults with risk enhancers despite 3 months of optimized lifestyle; triglycerides ≥500 mg/dL (urgent treatment to prevent pancreatitis); LDL above 70 mg/dL in high-risk patients already on maximal statin therapy (add ezetimibe or PCSK9 inhibitor).
Medication strongly indicated: Any LDL in the context of established ASCVD — statin is standard of care; LDL ≥190 mg/dL — high-intensity statin; LDL ≥70 mg/dL in very-high-risk patients on statin plus ezetimibe — PCSK9 inhibitor is guideline-consistent.
For deeper context on what’s causing elevated numbers, see causes of high cholesterol. For testing frequency, see how often should cholesterol be checked. For medication options, see statins what adults should know. For the fundamental definitions, see what is cholesterol and LDL vs HDL cholesterol.
Sources
American Heart Association — What Your Cholesterol Levels Mean (heart.org) | American College of Cardiology — 2019 ACC/AHA Cholesterol Guideline (acc.org) | Centers for Disease Control and Prevention — Cholesterol Facts (cdc.gov) | Grundy SM et al. 2018 AHA/ACC Cholesterol Guideline. JACC 2019;73(24):e285–e350 | Cholesterol Treatment Trialists Collaboration. Lancet 2010;376:1670–81
Understanding Your Lipid Panel in Full — Numbers and Their Relationships
A lipid panel is most useful when all four components are read together rather than evaluated in isolation. The relationships between the numbers often reveal risk that any single value would miss.
High total cholesterol, high HDL, normal LDL: This pattern is often benign. Some individuals have naturally elevated HDL due to genetics — this raises total cholesterol but may actually represent a favorable lipid profile. An LDL of 95 mg/dL and HDL of 80 mg/dL produces a total cholesterol of 175 mg/dL + VLDL; but a total cholesterol of 230 mg/dL with an HDL of 75 mg/dL and LDL of 130 mg/dL is far less concerning than the total cholesterol number suggests. Looking at the breakdown, not just the headline number, is essential.
Normal LDL, low HDL, elevated triglycerides: This triad is the lipid signature of insulin resistance and metabolic syndrome. It often coexists with high LDL particle number (high ApoB or LDL-P) despite a seemingly acceptable LDL cholesterol value. This discordance — where LDL-C is normal but atherogenic particle burden is elevated — is associated with higher cardiovascular risk than the LDL number alone would predict. Clinicians sometimes order ApoB in this setting to get a more accurate picture of actual particle burden.
Very high triglycerides with any LDL value: When triglycerides exceed 400 mg/dL, the Friedewald equation used to calculate LDL becomes unreliable, often underestimating true LDL. In this setting, the lipid panel should be reported with a direct LDL measurement or non-HDL cholesterol used as the primary target value. This is also the range where chylomicronemia syndrome and severe familial hypertriglyceridemia may be present, warranting further lipid subspecialty evaluation.
LDL above 190 mg/dL without another explanation: This LDL level in the absence of secondary causes (hypothyroidism, nephrotic syndrome, cholestasis, obesity) is the diagnostic threshold that triggers evaluation for familial hypercholesterolemia. Dutch Lipid Clinic Criteria use a combination of LDL level, personal history, family history, physical signs (tendon xanthomas, corneal arcus), and genetic testing to confirm FH diagnosis. FH patients are treated as high risk regardless of their calculated 10-year cardiovascular risk score.
How Cardiovascular Risk Changes Over Time — and Why Retesting Matters
Cholesterol numbers are not static. They shift across the lifespan in response to biological aging, body composition changes, dietary patterns, physical activity levels, medications, and the development of new health conditions. Understanding how risk evolves helps explain why periodic rechecking is essential even for people who had acceptable results in the past.
Age and sex-related shifts: LDL cholesterol typically rises through adulthood in both men and women. In women, the most significant lipid shift often occurs around menopause: estrogen normally upregulates hepatic LDL receptor expression, so the estrogen decline at menopause is associated with LDL rises of 10 to 15 percent in many women within 1 to 3 years of the menopausal transition. A woman who had an LDL of 105 mg/dL at age 45 may find her LDL climbing toward 125 to 130 mg/dL by age 55 without any change in diet — not because she’s eating differently, but because of the physiological hormonal shift.
Risk factor accumulation: The 10-year cardiovascular risk calculation that determines which risk category a person falls into changes as risk factors are added. A diagnosis of type 2 diabetes can move someone from intermediate risk to high risk with the same LDL. Development of hypertension adds to the Pooled Cohort Equations score. New medications can affect lipids (corticosteroids, retinoids, some HIV medications). This is why a 10-year risk recalculation with updated lipid data and risk factor status every 4 to 5 years is appropriate for most adults in the primary prevention setting.
Treatment-related changes: For patients on statin therapy, LDL should remain stable between annual checks if medication adherence is maintained and no new interactions have developed. If LDL rises significantly between annual tests — from 65 mg/dL to 110 mg/dL, for example — common causes include: non-adherence (missing doses or stopping medication), drug interaction with a new CYP3A4 inhibitor, weight gain driving increased hepatic cholesterol synthesis, new thyroid disease, or dietary changes that significantly increase saturated fat. Identifying the cause is more useful than simply increasing the statin dose.
The Practical Value of Knowing Your Risk Category
Understanding which cardiovascular risk category applies to you translates directly into practical decisions:
If you are in the low risk category with favorable lipid numbers, the practical implication is that dietary optimization and regular exercise are the primary tools, medication is not currently indicated, and follow-up testing at 4 to 6-year intervals is appropriate. LDL trends over time matter more than any single value.
If you are in the intermediate risk category with LDL above 100 mg/dL and one or more risk enhancers, the practical implication is that a clinician-patient conversation about statin therapy is appropriate — not a requirement, but a genuine benefit-risk discussion. The presence of risk enhancers (family history, hsCRP above 2, Lp(a) above 50 mg/dL) can tip this decision toward medication even if the 10-year risk score is not dramatically elevated. A coronary artery calcium score can help resolve uncertainty.
If you are in the high risk category with established ASCVD, the practical implication is that LDL below 70 mg/dL is the target, high-intensity statin is standard of care, and annual lipid panel monitoring is the minimum. Diet and exercise remain important — they work through complementary mechanisms that add to statin benefit — but they do not substitute for medication in this group.
If you are in the very high risk category, the evidence supports targeting LDL below 55 mg/dL. This often requires combination therapy (statin plus ezetimibe, and sometimes a PCSK9 inhibitor). The clinical benefit of achieving very low LDL in this population is substantial and well-documented.
Special Populations and Cholesterol Risk Thresholds
Certain populations have unique considerations that affect how cholesterol numbers translate into cardiovascular risk and treatment thresholds:
Women and cholesterol risk: Cardiovascular risk guidelines were historically derived from male-dominated datasets, and the Pooled Cohort Equations tend to underestimate risk in some women — particularly those with inflammatory conditions, premature menopause (before age 40), or a history of preeclampsia or gestational hypertension. Both preeclampsia and premature menopause are now listed as ACC/AHA 2019 risk enhancers specifically for women, reflecting evidence that these conditions independently increase cardiovascular risk beyond what the baseline risk calculator captures. Women with these histories should be evaluated for statin therapy at lower absolute calculated risk thresholds than the general intermediate-risk population.
South Asian and certain ethnic populations: The Pooled Cohort Equations were derived from cohorts that may not fully reflect risk in some ethnic groups. South Asian adults in particular have higher rates of metabolic syndrome, elevated Lp(a), and premature coronary artery disease relative to their calculated risk scores. The AHA has recognized that South Asian Americans warrant earlier and more aggressive cardiovascular risk assessment, with ACC/AHA 2019 noting ethnicity as a potential risk enhancer when discussing borderline-risk patients.
Adults with inflammatory disease: Rheumatoid arthritis, psoriasis (particularly moderate-to-severe), and HIV infection on antiretroviral therapy all independently increase cardiovascular risk through systemic inflammation, endothelial dysfunction, and in the case of some HIV medications, direct lipid adverse effects. These conditions are listed as risk enhancers in ACC/AHA 2019. Patients with these conditions may benefit from statin initiation at lower LDL levels or lower calculated risk thresholds than the general population guidance would suggest.
Chronic kidney disease: CKD substantially increases cardiovascular risk through multiple mechanisms including uremia-induced endothelial dysfunction, anemia, oxidative stress, and often coexisting diabetes and hypertension. CKD stages 3–4 (GFR 15–59 mL/min/1.73m²) is both a risk enhancer and a consideration that moves some patients into the very-high-risk category when combined with established ASCVD. The SHARP trial showed that simvastatin plus ezetimibe reduced atherosclerotic events in CKD patients — evidence supporting statin use even in dialysis-stage CKD where glomerular filtration is absent.
Secondary Causes of Elevated Cholesterol — Addressing Root Causes First
Before classifying an elevated cholesterol result as requiring primary lipid-lowering treatment, it is important to evaluate and address secondary causes — conditions that raise cholesterol through their underlying disease process rather than through primary lipid metabolism:
Hypothyroidism: One of the most common secondary causes of elevated LDL. Thyroid hormone normally stimulates both LDL receptor expression and bile acid synthesis — both mechanisms that clear LDL from the blood. When thyroid function is low, LDL can rise by 20 to 40 mg/dL. Treating hypothyroidism often normalizes LDL without any lipid-specific medication. A TSH measurement is reasonable in any adult with unexpectedly elevated LDL who does not have other clear risk factors for hyperlipidemia.
Diabetes and insulin resistance: While insulin resistance primarily raises triglycerides and lowers HDL, poorly controlled type 2 diabetes can also raise LDL through increased hepatic VLDL synthesis. Improving diabetes control — through diet, exercise, weight loss, or medications — improves the full lipid profile, particularly triglycerides. An HbA1c that falls from 9% to 7% on improved diabetes management is typically accompanied by meaningful triglyceride reduction.
Obesity: Excess body fat, particularly visceral abdominal fat, drives increased free fatty acid flux to the liver, increasing hepatic VLDL synthesis and triglyceride production. LDL particle number is also elevated in obesity even when LDL-C appears relatively normal. Weight loss — even 5 to 10 percent of body weight — produces measurable improvements across the entire lipid panel, often more substantially than dietary fat changes alone.
Medications: Several commonly prescribed medication classes can significantly affect cholesterol. Corticosteroids can raise LDL, triglycerides, and glucose, sometimes substantially at higher doses. Oral estrogen-containing contraceptives and hormone therapy can raise triglycerides. Retinoids (isotretinoin for acne) characteristically raise triglycerides and LDL while lowering HDL. Some atypical antipsychotics (olanzapine, clozapine, quetiapine) are associated with significant triglyceride elevation and metabolic syndrome. When a patient’s cholesterol has changed significantly after starting a new medication, the medication should be considered as a contributing cause before escalating lipid-lowering therapy.
Nephrotic syndrome: Kidney disease characterized by heavy protein loss in urine (proteinuria above 3.5g/day) is associated with marked hypercholesterolemia — the liver compensates for urinary protein loss by increasing hepatic protein synthesis, including lipoproteins. LDL can reach very high levels in nephrotic syndrome; treating the underlying kidney disease is the priority, and lipid management is adjunctive.
Identifying and addressing secondary causes before attributing elevated cholesterol to primary hyperlipidemia can significantly change the treatment approach — in some cases eliminating the need for lifelong lipid-lowering medication.
My cardiologist recommended I look into cholesterol numbers by risk level explained and this article covered it perfectly. It is refreshing to see an article that acknowledges individual variation rather than giving one-size-fits-all advice. Keep up this kind of thorough health journalism — it genuinely helps patients like me.
My cardiologist recommended I look into cholesterol numbers by risk level explained and this article covered it perfectly. I have tried following advice from several sources but this is the most consistent with what my specialist told me. Keep up this kind of thorough health journalism — it genuinely helps patients like me.
My cardiologist recommended I look into cholesterol numbers by risk level explained and this article covered it perfectly. It is refreshing to see an article that acknowledges individual variation rather than giving one-size-fits-all advice. Forwarding this to others in my support group who are dealing with similar issues.
Really well-written article on cholesterol numbers by risk level explained. It is refreshing to see an article that acknowledges individual variation rather than one-size-fits-all advice. Keep up this kind of thorough health journalism — it genuinely helps patients like me.
I shared this article on cholesterol numbers by risk level explained with my doctor and they appreciated the level of detail. It is refreshing to see an article that acknowledges individual variation rather than one-size-fits-all advice. Will definitely be coming back to this site for more health information.
Thank you for covering cholesterol numbers by risk level explained so thoroughly without being overly technical. The specific numbers and thresholds mentioned are exactly what I needed to understand my results. Looking forward to reading more articles from this website.