
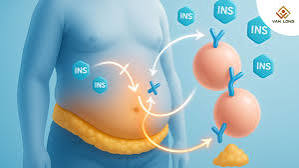
Weight Gain and Insulin Resistance: Understanding the Core Link
Of all the modifiable risk factors for Type 2 diabetes, the relationship between weight gain and insulin resistance is the most powerful and the best documented. Approximately 80–90% of people with Type 2 diabetes are overweight or obese, and the excess weight — particularly excess visceral adipose tissue stored around the abdominal organs — is not merely associated with diabetes but is a direct cause of the insulin resistance that drives it. Understanding the mechanism by which excess body fat impairs insulin signaling helps explain why weight loss — even modest weight loss — produces disproportionately large improvements in blood sugar control, and why preventing weight gain in the first place is one of the most effective diabetes prevention strategies available. Our guide on what is insulin resistance explains the cellular biology in detail; this article focuses specifically on the connection between adipose tissue accumulation and the progressive failure of insulin signaling that drives prediabetes and Type 2 diabetes.
What Insulin Resistance Means at the Cellular Level
Insulin resistance is a state in which cells — primarily muscle cells, liver cells, and fat cells — respond inadequately to insulin’s signal. In normal physiology, insulin binds to receptors on these cells and activates a cascade of intracellular signals that allow glucose transporters (primarily GLUT4 in muscle) to move to the cell surface and bring glucose inside. In insulin resistance, this signaling cascade is disrupted at multiple steps: the insulin receptor itself may function less efficiently, the downstream signaling proteins (particularly a pathway involving PI3K and Akt) are inhibited, and GLUT4 translocation to the cell surface is impaired. The result is that blood glucose remains elevated even in the presence of insulin, because the cellular machinery for glucose uptake is not working properly. The liver’s response to insulin resistance is particularly important: normally, insulin strongly suppresses the liver’s production of new glucose (gluconeogenesis) between meals. In insulin resistance, this suppressive effect is blunted, and the liver continues producing glucose even when blood glucose is already elevated — adding hepatic glucose output on top of impaired peripheral uptake, compounding hyperglycemia. Our guide on what causes high blood sugar covers these multiple contributors to hyperglycemia and how they interact in people with established insulin resistance.
How Excess Fat Causes Insulin Resistance: The Mechanisms
The pathway from excess adipose tissue accumulation to insulin resistance involves several distinct but interacting mechanisms, all of which have been well characterized in metabolic research.
Ectopic fat deposition: When adipose tissue depots become saturated with stored fat — which happens as obesity progresses — fat begins to deposit in organs where it does not belong: the liver (hepatic steatosis), skeletal muscle, the pancreas, and the heart. This ectopic fat is particularly toxic to insulin signaling. In the liver, intracellular fat accumulation directly interferes with insulin receptor signaling and drives the dysregulated hepatic glucose production described above. In skeletal muscle, intramyocellular lipid accumulation impairs GLUT4 translocation and reduces glucose uptake. The severity of insulin resistance correlates more closely with the amount of ectopic fat — particularly liver fat — than with total body weight or BMI, which is why two people with the same BMI can have very different degrees of insulin resistance depending on how their fat is distributed.
Free fatty acid excess: Adipose tissue in overweight and obese individuals releases free fatty acids into the bloodstream at higher rates than healthy-weight individuals. These circulating free fatty acids are taken up by the liver and muscle, where they generate lipid metabolites (particularly ceramides and diacylglycerol) that directly inhibit insulin receptor signaling at the molecular level. This “lipotoxicity” mechanism is one of the most direct molecular links between excess fat and insulin resistance, and it explains why elevated triglycerides (which correlate with high free fatty acid levels) are almost universally present in people with significant insulin resistance.
Adipose tissue inflammation: Expanding adipose tissue — particularly visceral adipose tissue — triggers an inflammatory response. As fat cells enlarge, they become stressed, release danger signals, and recruit immune cells called macrophages. These macrophages shift to an inflammatory phenotype within the fat tissue, releasing inflammatory cytokines including tumor necrosis factor-alpha (TNF-alpha) and interleukin-6 (IL-6). These circulating cytokines impair insulin signaling in muscle, liver, and fat tissue directly — TNF-alpha in particular phosphorylates insulin receptor substrate proteins at specific sites that inhibit rather than activate downstream signaling. This systemic low-grade inflammation driven by adipose tissue is a central mechanism linking obesity to insulin resistance, and it also explains why obesity is associated with higher cardiovascular disease risk, since the same inflammatory milieu promotes atherosclerosis. Our guide on hormones and blood sugar explains how adipokines from fat tissue interact with the broader hormonal regulation of glucose, including the role of adiponectin (which is reduced in obesity and has insulin-sensitizing effects) and leptin resistance.

Visceral Fat vs. Subcutaneous Fat: Why Location Matters
Not all body fat poses the same metabolic risk — and understanding the difference between visceral fat and subcutaneous fat is essential for understanding why some weight gain patterns are far more dangerous for blood sugar than others. Subcutaneous fat is stored under the skin throughout the body (arms, thighs, buttocks, and to a lesser extent the abdomen) and is metabolically relatively inert. Visceral fat is stored within the abdominal cavity, surrounding the organs — liver, pancreas, intestines — and has dramatically higher metabolic activity. Visceral fat cells are more metabolically active, release more free fatty acids into the portal circulation (which goes directly to the liver), and produce more inflammatory cytokines than subcutaneous fat cells. The same total amount of body fat concentrated viscerally produces much more insulin resistance and metabolic disease risk than if distributed subcutaneously. Waist circumference — a proxy for visceral fat accumulation — is therefore a better predictor of diabetes risk than BMI alone. Risk thresholds commonly used in clinical practice are waist circumference above 35 inches (88 cm) in women and above 40 inches (102 cm) in men, though these thresholds may be lower in Asian populations, where visceral fat accumulation at lower BMI values poses similar metabolic risk. Our guide on diabetes risk factors covers waist circumference and other anthropometric measures used to assess diabetes risk in clinical screening.
The Progressive Pathway: From Weight Gain to Type 2 Diabetes
The development of Type 2 diabetes from weight gain follows a recognizable progression that typically spans years to decades, with clear intervention points at each stage. The sequence begins with insulin resistance developing in skeletal muscle — often the first tissue affected — as ectopic fat and circulating free fatty acids begin to impair insulin signaling. Initially, the pancreatic beta cells compensate by secreting more insulin, maintaining normal blood glucose despite worsening insulin resistance. This compensatory hyperinsulinemia can maintain normal fasting glucose (below 100 mg/dL) and normal A1C (below 5.7%) for years, even as insulin resistance worsens significantly. As insulin resistance continues to progress — driven by ongoing weight gain, physical inactivity, and aging — beta cells are pushed to their limits of compensation and begin to lose function. At this stage, the prediabetes threshold is crossed: fasting glucose 100–125 mg/dL, post-meal glucose 140–199 mg/dL at two hours, A1C 5.7–6.4%. Without intervention, 10–25% of people with prediabetes progress to full Type 2 diabetes each year. When beta cell function declines further and insulin output is inadequate to overcome even fasting hepatic glucose output, fasting blood glucose rises above 126 mg/dL and A1C reaches 6.5% or higher — the diagnostic threshold for Type 2 diabetes. Our guide on what is prediabetes details this progression and explains what the window of prediabetes — when insulin resistance is established but beta cell function is still partially intact — represents as an intervention opportunity. Our guide on what the A1C test means covers how these stages are tracked and what results at each stage indicate about disease trajectory.
Why Not Everyone With Obesity Develops Diabetes: Genetic and Metabolic Variability
While the relationship between weight gain and insulin resistance is powerful, it is not deterministic — and approximately 20–30% of obese individuals maintain normal insulin sensitivity and never develop diabetes. Understanding why helps clarify the distinction between weight as a major contributor and weight as the sole cause. Several factors modulate the insulin resistance response to excess weight. Genetic variation in insulin receptor sensitivity, beta cell function, and adipose tissue inflammatory responses means that the same amount of weight gain produces different degrees of insulin resistance in different people. Fat distribution patterns — driven partly by genetics, sex, and ethnicity — determine how much visceral fat accumulates per unit of total weight gain, with some individuals storing proportionally more subcutaneous fat (less metabolically harmful) and others storing more visceral fat at the same total body weight. Fitness level and skeletal muscle mass independently affect insulin sensitivity: physically fit individuals with higher muscle mass have more tissue capable of insulin-stimulated glucose uptake, providing metabolic buffer against weight-driven insulin resistance. These variations explain why metabolic health — rather than weight or BMI alone — is the more accurate predictor of diabetes risk. They also mean that lifestyle interventions (particularly physical activity) can meaningfully improve insulin sensitivity even without substantial weight loss, though the combination of weight loss plus exercise produces the largest improvements. Our guide on what is diabetes provides the broader context of how genetic and environmental factors interact in diabetes development.
The Effect of Weight Loss on Insulin Resistance: What the Evidence Shows
The most powerful and most immediately actionable finding in obesity-diabetes research is the responsiveness of insulin resistance to modest weight loss. Clinical trials consistently show that losing as little as 5–10% of body weight — without reaching a “normal” BMI — produces significant and clinically meaningful reductions in insulin resistance, fasting glucose, and A1C in people with prediabetes or early Type 2 diabetes. The Diabetes Prevention Program (DPP), the landmark clinical trial that established lifestyle intervention as the most effective diabetes prevention strategy available, showed that a 7% weight loss target combined with 150 minutes of moderate-intensity physical activity per week reduced progression from prediabetes to Type 2 diabetes by 58% over three years — significantly outperforming the diabetes medication metformin (31% reduction) in the same trial. The mechanism is direct: even modest weight loss reduces visceral fat disproportionately relative to total body weight, reduces free fatty acid release from adipose tissue, reduces adipose tissue inflammation and circulating inflammatory cytokines, and reduces ectopic fat in the liver — all of the mechanisms that drive insulin resistance. Studies using liver fat imaging have shown that a 5% weight loss can reduce liver fat by 30–40%, producing substantial improvements in hepatic insulin resistance even before significant changes in other markers of metabolic health are apparent. For people with established Type 2 diabetes, more intensive weight loss — 15% or more of body weight — can produce diabetes remission (blood glucose returning to below the diagnostic threshold without medication) in a substantial proportion of cases; the DiRECT trial demonstrated remission rates of 46% at one year and 36% at two years with an intensive dietary weight-loss intervention in people with recent-onset Type 2 diabetes. Our guide on what is prediabetes explains why the prediabetes stage represents the highest-leverage window for weight-loss intervention, when beta cell function is still partially intact and reversing insulin resistance can prevent the final step to full diabetes.
Exercise and Insulin Sensitivity: The Weight-Independent Effect
Physical activity improves insulin sensitivity through mechanisms that are independent of — and additive to — the effects of weight loss, making exercise one of the most powerful tools for managing insulin resistance even in people who are not losing weight. The most important mechanism is the activation of GLUT4 translocation in skeletal muscle through a non-insulin-dependent pathway involving AMPK (AMP-activated protein kinase) and calcium signaling. During muscle contraction, GLUT4 transporters move to the cell surface and facilitate glucose uptake without requiring insulin binding — meaning that exercise essentially bypasses the insulin signaling defect that causes insulin resistance, allowing glucose to enter muscle cells through an alternative door. A single session of moderate-intensity aerobic exercise (30–45 minutes of brisk walking or cycling) improves insulin sensitivity in skeletal muscle for 24–72 hours afterward in people with insulin resistance — an effect that is detectable by glucose clamp measurement and that translates into lower post-meal blood glucose on the day after exercise. Regular aerobic exercise also reduces visceral fat (disproportionately to total weight loss, similar to the effect seen with dietary weight loss), reduces circulating inflammatory cytokines from adipose tissue, and improves mitochondrial function in muscle cells — all of which contribute to sustained improvements in insulin sensitivity beyond the immediate post-exercise effect. Resistance training (strength training) adds a complementary and distinct benefit: it increases skeletal muscle mass, creating more tissue that can take up insulin-stimulated glucose and thereby increasing the body’s overall glucose disposal capacity. Combined aerobic and resistance training produces the largest improvements in insulin sensitivity and glycemic control of any exercise modality. Our guide on blood sugar spikes: why they happen includes the effect of physical activity on post-meal glucose spikes as one of the most reliably effective interventions for blunting the glycemic response to carbohydrate intake — an effect that is mediated through the insulin-sensitizing action of prior exercise on skeletal muscle.
Dietary Approaches That Directly Reduce Insulin Resistance
Beyond caloric restriction for weight loss, specific dietary patterns have direct effects on insulin resistance that are at least partly independent of total caloric intake or weight change. Understanding these dietary mechanisms allows people with insulin resistance to make food choices that target the underlying biology, not just calorie balance.
Reducing refined carbohydrates: High intake of refined carbohydrates and added sugars drives repeated large glucose spikes that require high insulin output, contributing to beta cell exhaustion and worsening insulin resistance over time. Replacing refined carbohydrates with fiber-rich whole foods (legumes, vegetables, intact whole grains, berries) reduces the glycemic load of the diet, lowers post-meal glucose and insulin spikes, and reduces the progressive metabolic burden on the insulin system. Soluble fiber is particularly effective: it slows gastric emptying and glucose absorption, reduces the magnitude of post-meal glucose spikes, and is fermented by gut bacteria to produce short-chain fatty acids (particularly butyrate) that have direct insulin-sensitizing effects in the liver and muscle.
Quality of dietary fat: The composition of dietary fat affects insulin resistance independently of total fat intake. Saturated fats — particularly those from processed meats and full-fat dairy — promote insulin resistance through multiple mechanisms including promoting adipose tissue inflammation and increasing ceramide production (a lipid metabolite that inhibits insulin signaling). Monounsaturated fats (olive oil, avocado) and omega-3 polyunsaturated fats (fatty fish, walnuts, flaxseed) improve insulin sensitivity and reduce adipose tissue inflammation. The Mediterranean dietary pattern — high in monounsaturated fats, fiber, vegetables, legumes, and fish, low in processed meats and refined carbohydrates — consistently shows beneficial effects on insulin resistance and diabetes risk in clinical trials, and is one of the dietary patterns most consistently recommended by diabetes care guidelines. Our guide on dehydration and blood sugar provides complementary context on how overall dietary quality, including adequate hydration, affects glucose metabolism beyond macronutrient composition.
Meal timing and insulin resistance: Emerging evidence suggests that the timing of caloric intake affects insulin sensitivity beyond just the composition of what is eaten. Eating the same total calories distributed with a larger proportion earlier in the day (breakfast-heavy pattern) produces better insulin sensitivity and lower post-meal glucose than the same calories eaten later in the day (dinner-heavy pattern). This is related to the circadian rhythm of insulin secretion and insulin sensitivity, both of which are highest in the morning and decline across the day — meaning that the body processes the same amount of carbohydrate more efficiently at breakfast than at dinner. Time-restricted eating — confining food intake to an 8–10 hour window during the active part of the day — also shows promising effects on insulin sensitivity in early clinical research. While meal timing is a secondary consideration compared to overall dietary quality and caloric balance, it adds a practical dimension to diabetes prevention and management for people who are optimizing all aspects of their approach.
Sleep, Stress, and Weight: The Bidirectional Amplifiers of Insulin Resistance
Weight gain and insulin resistance do not occur in isolation from the rest of physiology, and two non-dietary factors — sleep deprivation and chronic psychological stress — both amplify the insulin resistance effects of excess weight and independently promote further weight gain, creating reinforcing cycles that are important to recognize and address. Sleep deprivation (defined as less than 6 hours per night chronically) reduces insulin sensitivity by 20–30% per night through cortisol elevation and growth hormone dysregulation, promotes increased appetite through leptin suppression and ghrelin elevation, and is associated with greater visceral fat accumulation over time independent of total caloric intake — meaning poor sleep actively drives the weight gain that worsens insulin resistance. Chronic psychological stress elevates cortisol chronically, which both directly raises blood glucose through insulin antagonism and promotes visceral fat accumulation specifically (cortisol drives preferential fat storage in the visceral depot through cortisol receptor density differences between visceral and subcutaneous fat). People who are managing both overweight-driven insulin resistance and chronic stress or sleep deprivation face a compounded metabolic burden that explains why the same dietary and exercise interventions work better in people with adequate sleep and lower stress. Integrating sleep optimization and stress management alongside dietary and exercise interventions is not optional for people trying to reverse insulin resistance — it is part of the core treatment approach. Our guide on how to track your blood sugar numbers describes how systematic monitoring that includes notes about sleep and stress alongside glucose readings helps identify these patterns and provides the data needed to prioritize the most impactful interventions for each individual.
Sources: American Diabetes Association. “Standards of Medical Care in Diabetes.” Diabetes Care 2024. | National Institute of Diabetes and Digestive and Kidney Diseases — Diabetes Risk Factors. | Endocrine Society — Insulin Resistance. | Mayo Clinic — Type 2 Diabetes: Symptoms and Causes. | Samuel VT, Shulman GI. “The pathogenesis of insulin resistance: integrating signaling pathways and substrate flux.” J Clin Invest 2016.
I never fully understood weight gain and insulin resistance: how until I read this. I appreciated how the article addressed both the clinical side and the practical adjustments. Keep up this kind of thorough health journalism — it genuinely helps patients like me.
I never fully understood weight gain and insulin resistance: how until I read this. The specific numbers and thresholds mentioned are exactly what I needed to understand my results. This gave me real confidence going into my next specialist appointment.
This is one of the clearest explanations of weight gain and insulin resistance: how I have found. I appreciate that the article is careful about distinguishing between what is known and what is still being researched. Forwarding this to others in my support group who are dealing with similar issues.