
What Is Insulin Resistance? Causes and Solutions
At the root of prediabetes, Type 2 diabetes, metabolic syndrome, and a cluster of related conditions lies a single physiological problem: what is insulin resistance? It is the state in which the body’s cells fail to respond normally to the hormone insulin, requiring ever-increasing amounts of it to achieve the same blood sugar-lowering effect. Insulin resistance is not a sudden event — it develops gradually over years, driven by the interaction of genetic predisposition with modifiable lifestyle factors, silently reshaping metabolism long before any blood test falls into the diagnostic range for a specific disease. Understanding what insulin resistance is, why it develops, what it does to the body, and how it can be reversed is among the most important pieces of knowledge anyone can have about their long-term metabolic health.
What Is Insulin Resistance? The Core Concept
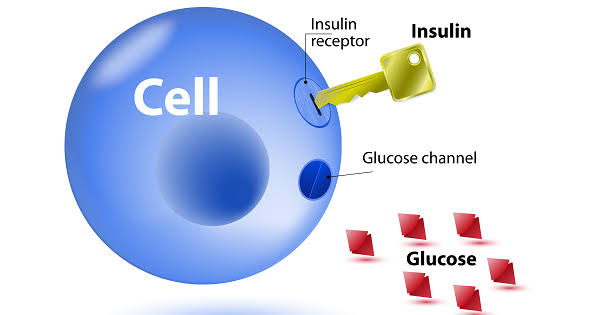
In a person with normal insulin sensitivity, a relatively modest amount of insulin — released by the pancreas after a meal — is sufficient to signal cells throughout the body to open their glucose transporters and absorb glucose from the blood. Blood sugar rises modestly after eating and returns to baseline within one to two hours as the insulin response efficiently clears the glucose.
In insulin resistance, this signal is blunted. Cells do not respond adequately to normal amounts of insulin. The molecular machinery through which insulin’s message travels — from receptor binding at the cell surface through a cascade of intracellular signaling proteins to GLUT4 transporter activation — becomes impaired at one or more steps. The result is that the same amount of insulin that would drive complete glucose clearance in a healthy person drives only partial clearance in an insulin-resistant person. Blood sugar remains higher and for longer after meals.
The pancreas detects this inadequate response and compensates by producing more insulin — sometimes three to five times the normal amount. This compensatory hyperinsulinemia keeps blood sugar near the normal range in the early stages of insulin resistance, which is why many people with significant insulin resistance have completely normal fasting glucose and A1C values for years. The condition is invisible to standard testing until beta cell compensatory capacity begins to fail, at which point blood sugar starts rising into the prediabetes range.
Understanding what insulin is and how it normally functions at the cellular level is foundational to appreciating how insulin resistance disrupts that process. The full story of how insulin binds receptors, activates signaling cascades, and opens glucose channels in healthy cells provides the context for understanding where these steps go wrong in resistance.
The Molecular Mechanisms of Insulin Resistance
Insulin resistance is not a single molecular defect but a family of related impairments that can affect different steps in the insulin signaling pathway. The most studied and clinically relevant mechanisms include:
Lipid accumulation in muscle and liver cells: Excess free fatty acids circulating in the blood — derived from the breakdown of visceral fat deposits and from dietary fat — enter muscle and liver cells and are converted into intermediate lipid metabolites (diacylglycerol, ceramide, fatty acyl-CoA) that directly interfere with insulin receptor substrate proteins. These metabolites activate serine kinases that phosphorylate insulin signaling intermediates at the wrong sites, preventing the normal activation cascade from proceeding. This “ectopic lipid” mechanism explains why visceral fat in particular is so strongly associated with insulin resistance — it continuously releases free fatty acids into the portal circulation, delivering them directly to the liver where they impair insulin signaling most acutely.
Inflammatory cytokine signaling: Enlarged fat cells and the immune cells (particularly macrophages) that accumulate within visceral fat tissue release pro-inflammatory cytokines — including TNF-alpha, IL-6, and IL-1beta — that circulate systemically and impair insulin signaling in target tissues. TNF-alpha, for example, directly phosphorylates insulin receptor substrate-1 (IRS-1) at serine residues that inhibit its function, blocking the downstream activation of PI3K and Akt — the core insulin signaling enzymes that drive GLUT4 translocation and glucose uptake.
Mitochondrial dysfunction: Insulin-resistant muscle cells consistently show reduced mitochondrial number, size, and oxidative capacity. This mitochondrial impairment reduces the cell’s ability to oxidize fat for fuel, leading to accumulation of the same lipid intermediates that impair insulin signaling. Whether mitochondrial dysfunction causes insulin resistance, results from it, or both is an area of ongoing research, but the association is robust and consistent across multiple cell types and species.
Endoplasmic reticulum (ER) stress: The ER is the cellular organelle responsible for protein folding and quality control, including the processing of insulin in beta cells and insulin receptor in target cells. Chronic nutrient excess, particularly excess saturated fat, triggers ER stress — an unfolding protein response that activates inflammatory kinases and impairs insulin receptor signaling. ER stress is increasingly recognized as a central mediator linking the modern diet to insulin resistance.
What Drives Insulin Resistance: Risk Factors
Insulin resistance develops at the intersection of genetic susceptibility and environmental exposures. The major contributors are well-established:
Excess visceral fat: Visceral adipose tissue — the fat deposited around the abdominal organs, distinct from subcutaneous fat stored under the skin — is metabolically active in a way that peripheral fat is not. It releases higher concentrations of inflammatory cytokines and free fatty acids directly into the portal circulation, targeting the liver with exactly the signals that impair insulin action most directly. Visceral fat accumulation is the single most consistent predictor of insulin resistance across populations. A large waist circumference (above 35 inches in women, above 40 inches in men) is the simplest clinical indicator of excess visceral adiposity.
Physical inactivity: Skeletal muscle is the body’s largest site of insulin-stimulated glucose uptake and the tissue where insulin resistance has its most quantitatively important effects on blood sugar. Sedentary behavior reduces GLUT4 transporter protein content in muscle, decreases mitochondrial density and oxidative capacity, and allows ectopic lipid accumulation — all of which worsen insulin sensitivity. Conversely, even a single bout of exercise temporarily improves muscle insulin sensitivity for 24 to 48 hours, explaining why physical activity is the most consistently effective lifestyle intervention for insulin resistance.
Poor sleep: Insufficient or disrupted sleep activates the HPA axis (hypothalamus-pituitary-adrenal), elevating cortisol, which directly impairs insulin signaling in liver, muscle, and fat cells. Studies using controlled sleep restriction (five to six hours versus eight hours) show 20 to 30 percent reductions in insulin sensitivity after just a few nights of inadequate sleep. Obstructive sleep apnea, affecting approximately 30 percent of obese adults, adds the additional mechanism of repeated nocturnal hypoxia (oxygen deprivation), which independently worsens insulin resistance.
Chronic psychological stress: Sustained stress activates the same cortisol and sympathetic nervous system pathways as sleep deprivation, chronically elevating counter-regulatory hormones that antagonize insulin’s effects. People with high chronic stress loads consistently show worse insulin sensitivity than those with comparable diet and activity levels under lower stress, explaining the well-documented association between psychosocial stress, metabolic syndrome, and Type 2 diabetes risk.
Diet quality: Diets high in refined carbohydrates and added sugars promote insulin resistance through multiple pathways: they drive visceral fat accumulation, produce chronic hyperinsulinemia (which downregulates insulin receptors), and generate the repeated large glucose and insulin spikes that accelerate beta cell exhaustion. High saturated fat intake contributes to the ectopic lipid accumulation and ER stress described above. Ultra-processed foods combine these effects and additionally alter the gut microbiome in ways that worsen metabolic function.
Genetics: Genetic variants affecting insulin receptor structure, downstream signaling proteins, beta cell function, fat cell metabolism, and inflammatory pathways all contribute to inter-individual differences in insulin sensitivity at any given body weight and activity level. This explains why some people with significant obesity maintain good insulin sensitivity, while others develop insulin resistance at relatively modest body weights — particularly a pattern seen in Asian populations, where Type 2 diabetes risk emerges at lower BMI values than in European populations.
- Fasting blood glucose: 100–125 mg/dL (prediabetes range)
- A1C: 5.7%–6.4% (prediabetes range)
- Fasting insulin: above 10–15 mIU/L (laboratory-dependent)
- HOMA-IR: above 2.0 (calculated from fasting glucose and insulin)
- Waist circumference: above 35 inches (women) / 40 inches (men)
- Triglycerides: above 150 mg/dL (especially with low HDL)
- Acanthosis nigricans: dark, velvety skin patches in skin folds (neck, armpits)
- Skin tags: multiple small skin growths, often in the same locations
How Insulin Resistance Progresses to Diabetes
Insulin resistance does not cause diabetes by itself — it requires a second failure: the decline of pancreatic beta cell compensatory capacity. For years, sometimes decades, the beta cells successfully maintain blood sugar within the normal range by producing increasing amounts of insulin. The trajectory from insulin resistance to diabetes is therefore determined by the rate at which beta cells exhaust under the pressure of chronically elevated insulin demand.
Research suggests that by the time fasting blood glucose reaches the prediabetes range (100–125 mg/dL), approximately 50 percent of beta cell function has already been lost compared to individuals with normal glucose tolerance at the same degree of insulin resistance. By the time a Type 2 diabetes diagnosis is made, 50 to 80 percent of beta cell mass may have been lost. Beta cell decline involves both functional impairment (reduced insulin secretory capacity per cell) and actual loss of beta cell mass through apoptosis (programmed cell death), potentially driven by the glucotoxicity and lipotoxicity that result from the sustained hyperglycemia and elevated free fatty acids that accompany progressive insulin resistance.
This is why treatment of Type 2 diabetes focuses not only on improving insulin sensitivity (to reduce the demand placed on beta cells) but also on protecting beta cell function — with medications that reduce glucose toxicity early (metformin) and newer agents (GLP-1 receptor agonists, SGLT-2 inhibitors) that have direct beta cell-protective and systemic metabolic benefits. Understanding what is prediabetes is understanding the clinical stage at which insulin resistance has become measurable but reversible action is still most effective.
Conditions Associated With Insulin Resistance
Insulin resistance is not a standalone condition — it is the metabolic core of a cluster of related disorders collectively called metabolic syndrome. All of the following conditions involve insulin resistance as a central or contributing mechanism:
- Metabolic syndrome: Defined by the combination of abdominal obesity, high blood pressure, elevated triglycerides, low HDL cholesterol, and impaired fasting glucose — all of which are driven by or worsen insulin resistance in a self-reinforcing cycle
- Prediabetes and Type 2 diabetes: The direct downstream consequence of uncompensated insulin resistance
- Polycystic ovary syndrome (PCOS): A hormonal condition in women in which insulin resistance drives excess androgen production by the ovaries, causing irregular periods, cysts, acne, excess hair growth, and fertility problems. Improving insulin sensitivity is a key treatment goal in PCOS regardless of diabetes status
- Non-alcoholic fatty liver disease (NAFLD): Insulin resistance promotes fat accumulation in liver cells (hepatic steatosis). NAFLD affects approximately 25 percent of the global adult population and is the most common liver disease worldwide, closely tied to the obesity and insulin resistance epidemic
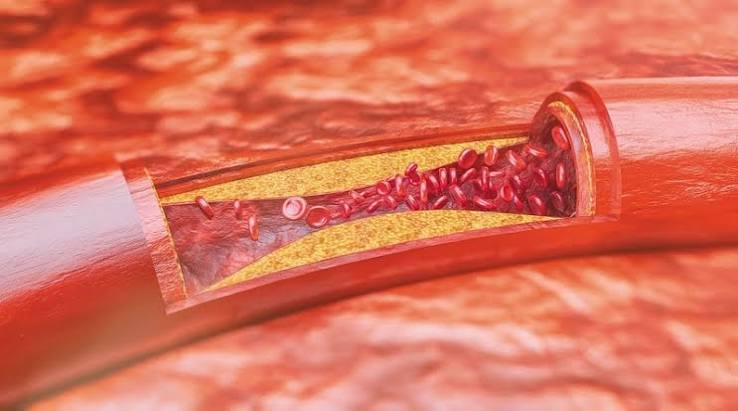
- Cardiovascular disease: Insulin resistance drives the dyslipidemia (high triglycerides, low HDL), hypertension, and inflammation that together accelerate atherosclerosis, independently of blood sugar levels
- Certain cancers: Chronic hyperinsulinemia promotes cell proliferation through insulin growth factor receptor signaling, and is associated with elevated risk of colorectal, endometrial, breast, and pancreatic cancers in epidemiological studies
How to Reverse Insulin Resistance
Insulin resistance is highly responsive to lifestyle intervention — more so than almost any other metabolic condition. The same factors that drive it can reverse it when modified, and the magnitude of improvement from consistent lifestyle changes is often comparable to or greater than pharmacological intervention.
Exercise — the most powerful intervention: Physical activity improves insulin sensitivity through multiple independent pathways. A single bout of moderate-intensity exercise (30 to 60 minutes of walking, cycling, or swimming) improves insulin sensitivity for 24 to 48 hours by activating AMPK, depleting muscle glycogen (creating room for glucose uptake), and reducing circulating free fatty acids. Chronic exercise training adds the benefits of increased GLUT4 transporter content, improved mitochondrial density, and reduced visceral fat mass. The combination of aerobic and resistance training produces the most comprehensive improvement across all of these mechanisms. Even brief post-meal walks (10 to 15 minutes) meaningfully reduce post-meal glucose peaks by driving muscle glucose uptake through contraction-stimulated pathways, bypassing the insulin resistance.
Weight loss: Even modest weight loss of 5 to 10 percent of body weight — achieved through any sustainable method — produces significant improvements in insulin sensitivity, particularly when the lost weight comes from visceral fat stores. Visceral fat is metabolically more active than subcutaneous fat and more responsive to both caloric restriction and exercise intervention, meaning it is often the first fat to be lost with lifestyle changes, producing disproportionate metabolic benefit relative to the amount lost.
Dietary changes: Replacing refined carbohydrates and added sugars with fiber-rich alternatives reduces the chronic insulin demand on beta cells and the hyperinsulinemia that worsens receptor sensitivity. Reducing saturated fat intake and increasing monounsaturated fat (olive oil, avocados) and omega-3 fatty acids (fatty fish, walnuts, flaxseed) addresses the ectopic lipid component of insulin resistance. Intermittent fasting and time-restricted eating approaches improve insulin sensitivity partly by reducing total insulin exposure over 24 hours, allowing insulin receptors to maintain sensitivity rather than being chronically stimulated.
Sleep optimization: Addressing sleep duration, consistency, and quality — including treating sleep apnea where present — is one of the most impactful and underutilized interventions for insulin resistance. Consistently sleeping seven to nine hours per night, maintaining a regular sleep schedule, and ensuring good sleep quality through adequate sleep hygiene produces measurable improvements in insulin sensitivity independent of other lifestyle changes.
Stress reduction: Chronic stress management through exercise (which also reduces cortisol), adequate sleep, mindfulness practices, and social support reduces the cortisol-driven component of insulin resistance. The effects are modest compared to exercise and weight loss, but meaningful in people with high chronic stress loads. Understanding the full context of why blood sugar matters for long-term health helps contextualize why addressing insulin resistance early and aggressively is worth the sustained effort required.
For people who have already developed prediabetes or Type 2 diabetes as a result of insulin resistance, the same lifestyle interventions remain foundational alongside medication. The body’s metabolic systems retain considerable plasticity — significant improvements in insulin sensitivity are achievable at any stage of the progression, and those improvements translate directly into better blood sugar control, reduced medication requirements, and lower risk of long-term complications. Monitoring progress via A1C and fasting glucose testing provides regular feedback on how well the interventions are working. For guidance on testing and interpreting results, see our guides on the A1C test and home blood sugar monitoring.
Measuring Insulin Resistance: Tests and Markers
Insulin resistance does not have a single universally accepted diagnostic test, partly because the “gold standard” measurement — the hyperinsulinemic-euglycemic glucose clamp — is a complex research procedure not practical for clinical use. In practice, insulin resistance is assessed through a combination of clinical markers and blood tests that collectively paint a reliable picture:
Fasting glucose and A1C are the most accessible measures of glucose dysregulation that results from insulin resistance. Blood sugar entering the prediabetes range (fasting glucose 100–125 mg/dL or A1C 5.7–6.4%) is strong evidence that insulin resistance has exceeded the pancreas’s compensatory capacity. However, these tests miss the early stage of insulin resistance when compensation is still successful and blood sugar remains normal.
Fasting insulin directly measures the pancreas’s compensatory output. Elevated fasting insulin (generally above 10–15 mIU/L, though laboratory reference ranges vary) in the setting of normal blood glucose suggests the beta cells are compensating hard — meaning significant insulin resistance is present even though blood sugar looks normal. This is the most sensitive early marker of insulin resistance, capable of detecting the condition years before blood sugar rises into the prediabetes range.
HOMA-IR (Homeostatic Model Assessment of Insulin Resistance) combines fasting glucose and fasting insulin into a single index: HOMA-IR = (fasting glucose in mg/dL × fasting insulin in mIU/L) / 405. Values above 2.0 suggest meaningful resistance; above 3.0 indicates significant resistance. HOMA-IR is not a formal diagnostic criterion but is widely used in research and increasingly in clinical settings to assess baseline insulin sensitivity and track response to intervention.
Triglycerides and HDL cholesterol are metabolic markers strongly correlated with insulin resistance. Elevated triglycerides (above 150 mg/dL) and low HDL (below 40 mg/dL in men, below 50 mg/dL in women) are core components of metabolic syndrome and consistently associated with insulin resistance even when blood sugar remains normal. A triglyceride-to-HDL ratio above 3.5 in the United States (using mg/dL values) has been validated as a surprisingly accurate predictor of insulin resistance in several studies.
Waist circumference and waist-to-hip ratio are the simplest clinical measures, reflecting the visceral fat accumulation that drives insulin resistance. For most clinical contexts, a waist measurement is the fastest and most accessible tool for assessing insulin resistance risk without any blood tests.
Insulin Resistance in Specific Populations
While insulin resistance is common across all populations, its presentation, threshold for clinical significance, and optimal intervention strategies vary in important ways across different groups.
Asian populations develop significant insulin resistance and Type 2 diabetes at lower body weights and BMI values than European populations — a pattern called “metabolic obesity at normal weight” or “thin-fat” phenotype. Asian individuals may have higher visceral fat relative to overall body fat, less muscle mass (reducing total glucose disposal capacity), and genetic variants that reduce beta cell reserve. This means the standard BMI thresholds for obesity (and therefore standard intervention triggers) underestimate metabolic risk in Asian adults. The American Diabetes Association recommends diabetes screening beginning at a BMI of 23 or above for Asian Americans (compared to 25 for other groups).
Women with PCOS have insulin resistance as a core feature of the condition, regardless of body weight — though excess weight worsens it. The insulin resistance in PCOS drives excess ovarian androgen production, which in turn contributes to the hallmark symptoms of irregular cycles, acne, hirsutism, and fertility challenges. Improving insulin sensitivity — through the same lifestyle interventions effective in Type 2 diabetes risk reduction — is a primary treatment strategy in PCOS and often produces improvements in cycle regularity, hormonal markers, and fertility independently of weight loss.
People with HIV receiving antiretroviral therapy have elevated rates of insulin resistance, driven by a combination of the inflammatory state of HIV infection itself and the metabolic side effects of certain antiretroviral medications (particularly older protease inhibitors). This population warrants proactive metabolic monitoring.
Older adults experience natural age-related declines in insulin sensitivity due to reduced muscle mass (sarcopenia), decreased GLUT4 transporter content, mitochondrial dysfunction, and increased inflammatory tone — all of which worsen with physical inactivity. Resistance training to maintain or build muscle mass is particularly important for preserving insulin sensitivity in older adults, and appears to attenuate much of the age-related metabolic decline when maintained consistently.
Regardless of which population group is most relevant to you, the core message about insulin resistance remains consistent: it is detectable, it is modifiable, and intervening earlier — before blood sugar rises into diagnostic ranges — produces the largest and most durable benefits. The evidence for lifestyle intervention is as strong as it is for almost any other preventive health measure available to adults today.
Sources: American Diabetes Association. Standards of Medical Care in Diabetes — 2024. Diabetes Care. 2024;47(Suppl 1):S20–S42. • Samuel VT, Shulman GI. Mechanisms for insulin resistance: common threads and missing links. Cell. 2012;148(5):852–871. • Colberg SR, et al. Physical activity/exercise and diabetes: a position statement of the American Diabetes Association. Diabetes Care. 2016;39(11):2065–2079.
Finally a resource that explains what is insulin resistance? causes and in plain language. The article answered questions I didn’t even know I had until I started reading. This is going into my health folder that I bring to every doctor’s visit.
As someone dealing with this personally, the what is insulin resistance? causes and section was very helpful. I have tried following advice from several sources but this is most consistent with what my specialist told me. Keep up this kind of thorough health journalism — it genuinely helps patients like me.
My doctor recommended I look into what is insulin resistance? causes and and this article covered it perfectly. The article answered questions I didn’t even know I had until I started reading. Thank you for making complex medical information accessible without dumbing it down.