
What Is an Electrocardiogram? Your ECG Guide
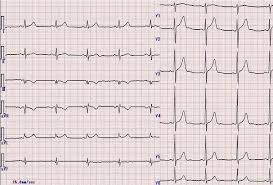
What is an electrocardiogram — and why does your doctor order one? The electrocardiogram (ECG, or EKG from the German Elektrokardiogramm) is the fundamental cardiac diagnostic test, recording the electrical activity that triggers every heartbeat as a continuous waveform tracing. First developed in the early 1900s by Willem Einthoven (who won the Nobel Prize in Physiology or Medicine in 1924 for its invention), the 12-lead ECG has become the most widely performed diagnostic test in medicine — performed over 300 million times annually worldwide — because it provides immediate, actionable diagnostic information about arrhythmias, conduction abnormalities, ischemia, infarction, and structural heart disease in a test that takes under 10 minutes and costs far less than any imaging alternative.
Understanding what an ECG measures, what the waveform components mean, and how to interpret your ECG report empowers patients to engage meaningfully with their cardiac evaluation — knowing what the test is looking for, whether results are reassuring or concerning, and what next steps a specific finding implies.
How an Electrocardiogram Works — The Physics of Cardiac Electricity
The heart’s electrical system generates a precisely timed sequence of electrical impulses with every heartbeat — originating in the sinoatrial (SA) node in the right atrium, conducting through the atrial muscle to the atrioventricular (AV) node, then through the His-Purkinje system (the bundle of His, left and right bundle branches, and Purkinje fibers) to activate the ventricular muscle simultaneously from the endocardial (inner) surface outward.
This coordinated electrical activation creates a dipole — a shifting electrical field that can be detected on the body surface by electrodes placed at standardized positions. The ECG machine records the potential difference between pairs of electrodes (leads) over time, producing the characteristic waveform tracing that is the ECG. Because the 12-lead ECG uses 12 different electrode combinations (leads) viewing the cardiac electrical field from 12 different angles, it localizes electrical abnormalities to specific regions of the heart — anterior, inferior, lateral, and posterior — with precision that allows experienced cardiologists to identify which coronary artery is occluded in an acute MI within seconds of seeing the tracing.
The 12 Leads — What Each One Views
The 12-lead ECG uses 10 electrode patches to generate 12 electrical “views” of the cardiac electrical field. Understanding which leads view which part of the heart is essential for interpreting localized findings:
Limb leads (I, II, III, aVR, aVL, aVF): These six leads record the cardiac electrical field in the frontal plane — the vertical cross-section of the body. Lead I (left arm minus right arm) views the heart from the left side; lead II (left leg minus right arm) views from the inferior-left; lead III (left leg minus left arm) from the inferior-right; aVR (augmented right arm) from the right shoulder; aVL (augmented left arm) from the left shoulder; aVF (augmented left foot) from below. The inferior leads (II, III, aVF) are particularly important for detecting inferior myocardial infarction (from right coronary artery occlusion); the lateral leads (I, aVL) detect lateral wall ischemia or infarction.
Precordial leads (V1 through V6): These six leads record the cardiac electrical field in the horizontal (transverse) plane, each electrode positioned at a standardized location on the chest wall. V1 and V2 (right precordial) face the right ventricle and septum; V3 and V4 (mid-precordial) face the anterior left ventricle; V5 and V6 (left precordial) face the lateral left ventricle. Anterior wall MI (from left anterior descending artery occlusion) produces ST elevation in V1 through V4; lateral MI produces changes in V5 and V6; posterior wall MI (from circumflex or RCA occlusion) produces reciprocal tall R waves and ST depression in V1 and V2 rather than classic ST elevation (making posterior MI one of the most commonly missed ECG findings).
Reading the ECG Waveform — P Wave, QRS, T Wave, and Intervals
Each cardiac cycle produces a characteristic sequence of waveform components, each reflecting a specific electrical event in the cardiac conduction sequence:
P wave: Represents atrial depolarization — the electrical activation of the right atrium (early P wave, approximately the first 40 milliseconds) followed by the left atrium (late P wave). Normal P wave duration is less than 120 milliseconds and height less than 2.5 mm. P wave abnormalities include: bifid (notched) P wave in left atrial enlargement; peaked tall P wave in right atrial enlargement (P pulmonale); absent P waves in atrial fibrillation; abnormal P wave morphology in ectopic atrial rhythms originating outside the SA node.
PR interval: The time from P wave onset to QRS onset — representing conduction through the AV node. Normal 120 to 200 milliseconds (3 to 5 small boxes on the ECG paper at standard 25 mm/s paper speed). Prolonged PR (over 200 ms) = first-degree AV block (common in athletes, vagal tone, and medication effect); short PR (under 120 ms) = pre-excitation (Wolff-Parkinson-White syndrome, where an accessory pathway bypasses the AV node) or AV junctional rhythm.
QRS complex: Represents ventricular depolarization — the electrical activation of both ventricles nearly simultaneously through the His-Purkinje system. Normal QRS duration is less than 120 milliseconds (narrow QRS = supraventricular origin with normal conduction). Wide QRS (120 ms or more) indicates: left bundle branch block (LBBB) — notched M-shaped QRS in leads V5/V6 with discordant ST-T changes; right bundle branch block (RBBB) — rSR’ pattern in V1 with wide S wave in I and V6; or ventricular tachycardia (if the QRS morphology does not match typical bundle branch block patterns, or if the rate is very fast without P waves).
ST segment: The flat segment between QRS end and T wave onset, normally isoelectric (flat at baseline). The ST segment represents the plateau phase of ventricular action potential (no net depolarization or repolarization occurring). ST elevation above baseline (especially ≥1 mm in two or more contiguous limb leads or ≥2 mm in two or more contiguous precordial leads) in the appropriate clinical context indicates acute STEMI — a cardiac emergency where the affected coronary artery is completely occluded and requires emergency revascularization. Diffuse concave ST elevation with PR depression in multiple leads indicates pericarditis. ST depression indicates subendocardial ischemia or NSTEMI.
T wave: Represents ventricular repolarization. Normally upright in most leads except aVR (normally inverted) and V1 (may be inverted normally). T wave inversions in multiple leads may indicate ischemia, left ventricular hypertrophy with strain pattern, bundle branch block, Wellens syndrome (critical LAD stenosis), or electrolyte abnormalities. Peaked, tall, narrow (“hyperacute”) T waves are the earliest ECG sign of acute STEMI, appearing before ST elevation, and are also seen in hyperkalemia.
What Conditions Does an ECG Detect?
The electrocardiogram is the primary diagnostic test for a broad range of cardiac conditions, and the single best test for several:
Arrhythmias: ECG is the definitive test for identifying cardiac arrhythmias — atrial fibrillation, atrial flutter, supraventricular tachycardia, ventricular tachycardia, ventricular fibrillation, heart block, and sinus node dysfunction. The immediate ECG during a palpitation episode captures the arrhythmia; ambulatory Holter monitoring or implantable loop recorder extends the monitoring window for intermittent events.
Myocardial infarction: The ECG is the critical first test in chest pain evaluation — identifying STEMI (the most time-critical cardiac emergency) within seconds, guiding immediate activation of the cardiac catheterization laboratory. ECG signs of prior (old) MI include pathological Q waves — deep, wide negative deflections in leads corresponding to the infarcted territory — that persist permanently after transmural infarction.
Conduction abnormalities: Bundle branch blocks, fascicular blocks, AV blocks of all degrees, and pre-excitation syndromes (WPW) are directly and definitively identified on ECG. These findings may explain palpitations, syncope, or exercise intolerance, and guide decisions about pacemaker implantation or catheter ablation.
Left ventricular hypertrophy: Increased QRS voltage meeting established ECG criteria (Sokolow-Lyon criterion: S in V1 + R in V5 or V6 ≥35 mm) indicates LV hypertrophy from long-standing hypertension, aortic stenosis, or hypertrophic cardiomyopathy. LVH on ECG is associated with increased cardiovascular event risk independent of other factors.
Electrolyte abnormalities: Hyperkalemia produces a characteristic sequence of ECG changes with rising potassium — peaked T waves → PR prolongation → wide QRS → sine wave pattern → ventricular fibrillation. Hypokalemia produces flat T waves and prominent U waves (a positive deflection after the T wave). Hypercalcemia shortens the QT interval; hypocalcemia prolongs it. These electrolyte-ECG relationships make the ECG a useful immediate assessment tool in critically ill patients with known metabolic abnormalities.
What an ECG Cannot Tell You — Its Important Limitations
Understanding the limitations of the ECG prevents both false reassurance and unnecessary anxiety about its findings:
A normal ECG does not exclude heart disease: Patients with significant coronary artery disease, heart failure, or even a prior myocardial infarction can have a completely normal resting ECG. The resting ECG reflects only the electrical activity of the heart at rest; coronary stenoses that cause ischemia only during exertion may produce no resting ECG changes whatsoever. This is why a normal ECG in a patient with exertional chest pain prompts stress testing, not reassurance that the heart is structurally normal.
ECG captures only 10 seconds: The standard 12-lead ECG records approximately 10 seconds of cardiac electrical activity. Arrhythmias that occur intermittently — atrial fibrillation present only during high-stress periods, supraventricular tachycardia triggered by positional changes, or ventricular ectopy during exertion — will be completely missed if the 10-second recording captures only normal sinus rhythm.
Baseline abnormalities limit interpretation: Certain pre-existing ECG abnormalities — left bundle branch block, paced rhythm (ventricular pacing from an implanted pacemaker), and Wolff-Parkinson-White — produce baseline ST-T changes that make ischemic ST changes during a stress test uninterpretable. Patients with these baseline abnormalities require imaging-based stress testing (stress echocardiography or nuclear perfusion imaging) rather than standard exercise ECG testing.
How to Prepare for an ECG and What to Expect
The ECG is one of the simplest tests to undergo — requiring no preparation, no fasting, no medication changes, and causing no discomfort:
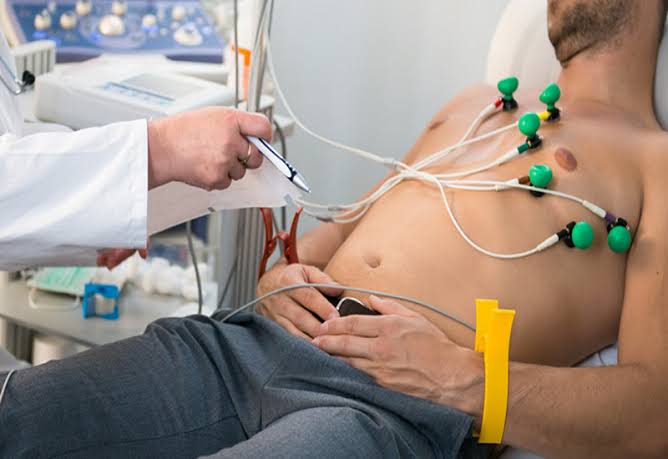
You will be asked to lie still on an examination table. A technician will apply 10 adhesive electrode patches to your chest, arms, and legs — the skin may be briefly cleaned with an alcohol wipe and a small amount of conductive gel applied to improve electrical contact. The machine runs for 10 to 20 seconds while you breathe normally and remain completely still (movement artifact from muscle electrical activity degrades the recording). Results are immediately available; in an emergency setting, a cardiologist or emergency physician will interpret the ECG within minutes of it being performed.
For the most meaningful interpretation: tell your provider about any cardiac symptoms you are experiencing at the time of the test; mention all medications (especially antiarrhythmics, digoxin, and QT-prolonging medications); and if possible, bring a copy of any prior ECGs for comparison — even subtle changes from a baseline ECG can be highly clinically significant in the right context.
See our related articles on common heart tests explained, what is an echocardiogram, stress test for heart health, heart palpitations causes, and atrial fibrillation symptoms and risks. The American Heart Association ECG guide, NHLBI electrocardiogram overview, and ACC ECG interpretation resources provide additional authoritative information.
- Surawicz B, Knilans TK. Chou’s Electrocardiography in Clinical Practice. 6th ed. Philadelphia: Saunders Elsevier; 2008.
- Thygesen K, et al. Fourth Universal Definition of Myocardial Infarction. J Am Coll Cardiol. 2018;72(18):2231-2264.
- Rautaharju PM, et al. AHA/ACCF/HRS Recommendations for the Standardization and Interpretation of the Electrocardiogram. Circulation. 2009;119(10):e241-e250.
- Agewall S, et al. Expert consensus document on electrocardiographic assessment of ischemia. Eur Heart J. 2016;37(15):1199-1208.
- January CT, et al. 2014 AHA/ACC/HRS Guideline for the Management of Patients with Atrial Fibrillation. J Am Coll Cardiol. 2014;64(21):e1-e76.
Common ECG Findings in Specific Conditions — What Your Report May Say
When a cardiologist or automated algorithm interprets your ECG, they generate a report listing specific findings. Understanding the most common findings and what they mean reduces anxiety and helps patients engage with their follow-up care:
“Normal sinus rhythm”: The heart is beating in its normal pattern — originating from the SA node at a regular rate of 60 to 100 beats per minute, with normal PR interval, narrow QRS, and normal ST-T waves. This is the most reassuring finding and does not require any specific follow-up unless the clinical history warrants further investigation.
“Sinus bradycardia”: Normal sinus rhythm but with heart rate below 60 beats per minute. Common in athletes and vagally-dominant individuals at rest; also seen with beta-blocker use, hypothyroidism, and sick sinus syndrome. Sinus bradycardia in a symptomatic patient (dizziness, near-syncope, extreme fatigue) requires further evaluation; in an asymptomatic athlete, it is completely normal and requires no action.
“Sinus tachycardia”: Normal sinus rhythm with heart rate above 100 beats per minute. Almost always a physiological response to something — fever, pain, dehydration, anemia, anxiety, hyperthyroidism, pulmonary embolism, or cardiac dysfunction. Sinus tachycardia itself is not an arrhythmia requiring antiarrhythmic treatment; the underlying cause is what matters.
“Atrial fibrillation” or “AF”: Irregularly irregular QRS rhythm without discernible P waves. The most clinically important common arrhythmia finding on ECG — requiring evaluation for rate control (beta-blockers, digoxin, or calcium channel blockers to slow the ventricular rate), rhythm control (antiarrhythmic drugs or catheter ablation to restore sinus rhythm), and anticoagulation (to prevent atrial appendage thrombus and cardioembolic stroke, guided by CHA₂DS₂-VASc risk score).
“Left bundle branch block” or “LBBB”: Wide QRS ≥120 ms with characteristic M-shaped morphology in V5/V6 and discordant ST-T changes. New LBBB in a patient with chest pain is considered a STEMI equivalent — requiring immediate evaluation for acute MI and potential emergency catheterization. Chronic LBBB (present on prior ECGs) typically indicates structural heart disease (cardiomyopathy, severe coronary artery disease, or hypertension) and limits the interpretation of stress ECG testing.
“Left ventricular hypertrophy” or “LVH”: Increased QRS voltage meeting established criteria — most commonly Sokolow-Lyon (S in V1 + R in V5 ≥35 mm) or Cornell voltage criteria. Indicates thickening of the left ventricular wall from chronic pressure overload (hypertension, aortic stenosis) or genetic cardiomyopathy (hypertrophic cardiomyopathy). LVH on ECG is associated with increased cardiovascular event risk and prompts evaluation of its cause and optimization of blood pressure control.
“Prolonged QT interval” or “QTc prolongation”: QTc ≥450 ms in men or ≥460 ms in women (with values above 500 ms carrying high risk of life-threatening ventricular arrhythmia). Causes include medications (antiarrhythmics, antipsychotics, antibiotics — a very long list requiring constant vigilance), electrolyte abnormalities (hypokalemia, hypomagnesemia, hypocalcemia), and congenital long QT syndrome (genetic ion channel mutations). Long QT requires identification and removal of causative medications and correction of electrolyte abnormalities; congenital long QT may require beta-blockade, mexiletine, or implantable defibrillator depending on subtype.
The ECG in the Emergency Setting — Time Is Muscle
The single most time-critical application of the ECG is the identification of ST-elevation myocardial infarction (STEMI) in the emergency department. STEMI occurs when a coronary artery is completely occluded — typically by plaque rupture and acute thrombus formation — cutting off blood supply to the affected myocardial territory. Without revascularization, myocardial cells in the ischemic zone begin dying within 20 to 40 minutes of occlusion, and the amount of myocardium lost correlates directly with the time from occlusion to reperfusion: “time is muscle” is the foundational principle of STEMI management.
The ECG is the decisive diagnostic test for STEMI — it identifies the need for emergency cardiac catheterization and percutaneous coronary intervention (primary PCI) within seconds of interpretation, allowing immediate activation of the cath lab team while the patient is still in the emergency department. The ACC/AHA guideline target for “door-to-balloon time” (time from hospital arrival to coronary artery reperfusion by balloon angioplasty) is 90 minutes or less — a target achievable only because the ECG provides immediate diagnosis without waiting for blood test results or imaging.
The emergency ECG interpretation for STEMI follows a specific pattern recognition approach: ST elevation in specific lead groups identifies which coronary artery is occluded and which wall of the heart is at risk. Inferior STEMI (ST elevation in II, III, aVF with reciprocal depression in I, aVL) = right coronary artery occlusion. Anterior STEMI (ST elevation in V1–V4, especially V2–V4) = left anterior descending artery occlusion — the highest-risk STEMI territory, supplying the largest myocardial territory. Lateral STEMI (ST elevation in I, aVL, V5, V6) = circumflex or diagonal branch occlusion. Posterior STEMI (tall R wave and ST depression in V1–V2 — the mirror of posterior ST elevation) = posterior circumflex or right coronary artery occlusion — the most commonly missed STEMI pattern because the affected leads show the opposite of the expected ST elevation.
ECG Screening and Routine Use — When Is an ECG Ordered?
ECGs are ordered in a wide range of clinical contexts, reflecting their utility across the full spectrum of cardiac and non-cardiac conditions:
Routine preoperative evaluation: Most adults over 50 (or younger patients with cardiac risk factors) undergoing non-cardiac surgery will have a preoperative ECG as part of anesthetic risk assessment. The goal is identifying baseline abnormalities — prior MI (Q waves), LBBB, LVH, QT prolongation, or arrhythmias — that would change the anesthetic approach, require preoperative cardiology evaluation, or influence postoperative monitoring decisions. Perioperative myocardial infarction produces characteristic ECG changes; having a preoperative baseline allows reliable identification of new changes after surgery.
Annual cardiac monitoring in high-risk patients: Patients taking QT-prolonging medications (antipsychotics, antiarrhythmics, certain antibiotics), those with known conduction abnormalities requiring monitoring for progression, and patients with pacemakers (to verify appropriate pacemaker function) may receive annual or more frequent ECGs as part of routine cardiac monitoring.
Sports pre-participation screening: Many international sports federations (including FIFA, UEFA, and the International Olympic Committee) recommend pre-participation ECG screening for competitive athletes to detect conditions causing sudden cardiac death — hypertrophic cardiomyopathy, long QT syndrome, arrhythmogenic right ventricular cardiomyopathy, Wolff-Parkinson-White syndrome, and channelopathies. The interpretation of athlete ECGs uses sport-specific criteria (the “Seattle Criteria” updated in 2017) that account for the many normal ECG changes of athletic conditioning (sinus bradycardia, early repolarization, increased voltage from physiological LVH) to minimize false-positive referrals while maintaining sensitivity for true pathological findings.
Emergency prehospital ECG: Modern paramedic systems in most high-income countries are equipped with portable 12-lead ECG machines, allowing STEMI identification in the field before hospital arrival. Prehospital ECG transmission to the receiving hospital emergency department allows immediate activation of the cath lab team while the patient is still in the ambulance — reducing door-to-balloon time to well below the 90-minute guideline target in well-organized systems. Studies have documented door-to-balloon times under 30 minutes in centers with prehospital ECG transmission and direct cath lab activation protocols — saving significant myocardium compared to historical pre-ECG-transmission practice.
Digital ECG and the Future of Cardiac Electrical Recording
The ECG is undergoing its most significant technological evolution since its invention — driven by wearable technology and artificial intelligence-based interpretation:
Wearable single-lead ECG: Smartwatches and wearable devices from Apple, Samsung, Fitbit, and others now incorporate optical heart rate monitoring and, in more advanced devices, single-lead ECG recording capabilities (the Apple Watch ECG app, cleared by the FDA in 2018, records a single-lead rhythm strip using the device crown and the wearer’s wrist as the two electrode poles). Single-lead wearable ECGs are not equivalent to a diagnostic 12-lead ECG — they cannot localize ischemia, detect bundle branch blocks with certainty, or measure the QT interval reliably — but they are highly sensitive for atrial fibrillation detection, with multiple studies confirming that Apple Watch AF alerts have a positive predictive value of approximately 84 percent for confirmed AF.
AI-enhanced ECG interpretation: Machine learning algorithms trained on millions of labeled 12-lead ECGs have demonstrated diagnostic accuracy equivalent to or exceeding experienced cardiologists for several conditions — including atrial fibrillation, hypertrophic cardiomyopathy, reduced ejection fraction, and hyperkalemia. Remarkably, AI-ECG algorithms trained specifically to predict low ejection fraction can identify patients with significant left ventricular dysfunction (EF below 35 percent — the threshold for ICD implantation) from a standard ECG with 85 to 93 percent accuracy — a finding that a trained cardiologist cannot reliably make from the ECG alone, as the ECG does not directly image heart function. These AI applications are actively transforming how ECGs are used for population-level cardiovascular screening.
Finally a resource that explains what is an electrocardiogram? your ecg in plain language. The section on managing this condition day-to-day was especially useful for meal planning. Appreciate the effort that went into researching and writing this — it shows.
Came across this while researching what is an electrocardiogram? your ecg for a family member. I especially valued the explanation of why these recommendations exist, not just what they are. This is going into my health binder that I bring to every doctor’s visit.
Finally a resource that explains what is an electrocardiogram? your ecg in plain language. The section on managing this condition day-to-day was especially useful for meal planning. Forwarding this to others in my support group who are dealing with similar issues.
Finally a resource that explains what is an electrocardiogram? your ecg in plain language. I have tried following advice from several sources but this is most consistent with what my specialist told me. Shared this with three friends who are dealing with related issues. Very useful resource.
This is one of the clearest explanations of what is an electrocardiogram? your ecg I have found. The article answered questions I didn’t even know I had until I started reading. Thank you for making complex medical information accessible without dumbing it down.
I shared this article on what is an electrocardiogram? your ecg with my doctor and they appreciated the level of detail. It is refreshing to see an article that acknowledges individual variation rather than one-size-fits-all advice. This is exactly why I prefer this website over generic health platforms.