
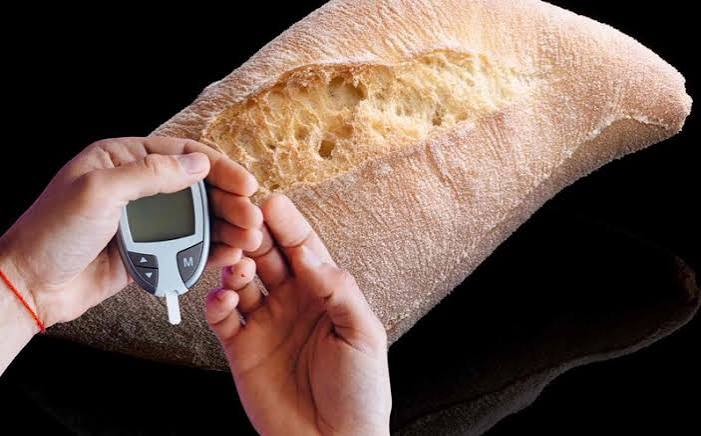
Few dietary decisions affect bread and blood sugar management more directly than bread selection — bread is consumed by most American adults at breakfast, lunch, and dinner (as toast, sandwiches, rolls, and accompaniments), making it one of the most consistently impactful dietary variables for blood glucose control. The challenge is that bread’s impact on blood sugar varies enormously by type: standard white bread (GI 70–75) produces a blood glucose spike virtually identical to eating the equivalent amount of pure glucose, while dense 100% whole grain bread (GI 49–55), sourdough (GI 54–68), and traditional dense rye bread (GI 41–46) produce substantially lower and more gradual glucose responses from equivalent carbohydrate loads. Understanding what drives these differences — and how to identify genuinely blood-sugar-favorable bread amid a supermarket bread aisle full of misleading labels — allows adults managing diabetes or prediabetes to continue eating bread while substantially reducing its blood glucose impact. The bread and blood sugar relationship is also highly susceptible to marketing-driven confusion: “wheat bread,” “multigrain bread,” and “7-grain bread” often contain as much refined white flour as standard white bread and produce similar blood glucose responses despite their health-food branding and premium pricing. Learning to read bread labels accurately — looking at fiber content, whole grain flour position in the ingredient list, and actual glycemic index data rather than health claims — is a critical practical skill for adults managing blood glucose through dietary choice.
Two slices of white bread (GI 73, 26g carbs) produce a glycemic load of approximately 19 — equivalent to a can of regular soda. The same weight of 100% whole grain pumpernickel bread (GI 41, similar carbs) produces a glycemic load of approximately 11 — nearly half the blood sugar impact from the same serving size and carbohydrate content. Bread type matters more than bread quantity for blood sugar management.
Bread Varieties Ranked by Blood Sugar Impact
Not all bread affects bread and blood sugar outcomes equally. From lowest to highest glycemic impact:
- Dense rye bread / pumpernickel (GI 41–46 — lowest): Traditional dense rye breads made from whole rye kernels (not refined rye flour) have the lowest glycemic index of any common bread type. Rye’s unique fiber composition — particularly its high arabinoxylan and beta-glucan soluble fiber content — forms exceptionally viscous gels in the stomach that dramatically slow starch digestion and glucose absorption. True pumpernickel (long-fermented, made from whole rye meal without added refined flour) produces blood glucose responses more similar to legumes than to wheat bread. Identifying genuine dense rye: the bread should be dense and heavy, dark brown to black in color, with “whole rye” or “rye meal” as the first ingredient — not “rye flour” or “wheat flour with rye flavor.” Crispbread varieties (Wasa, Ryvita) made from whole rye also provide low-GI rye grain benefits in a more familiar form.
- 100% whole grain bread (GI 49–55 — low to moderate): Bread made entirely from 100% whole grain flour — with the germ and bran intact — provides substantially more fiber (2.5–3g per slice versus 0.5g for white bread), magnesium, B vitamins, and the lignans and phenolic acids concentrated in grain bran that have independent associations with improved insulin sensitivity. The key identification criterion: “100% whole wheat” or “100% whole grain” as the label description, with whole wheat flour as the sole or overwhelmingly dominant ingredient. Most “whole wheat” breads in supermarkets contain significant proportions of refined white flour alongside whole wheat flour — check the ingredient list, where “enriched flour” appearing before or alongside “whole wheat flour” indicates the product is not 100% whole grain despite its labeling.
- Sourdough bread (GI 54–68, varies by fermentation): Sourdough fermentation produces lactic and acetic acids that lower bread’s glycemic index through several mechanisms: the acids slow gastric emptying, partially denature starch structures making them more resistant to rapid amylase digestion, and modify gluten protein in ways that reduce the bread’s starch digestibility rate. Genuine long-fermented sourdough (12–24+ hour ferment) produces more pronounced glycemic benefit than sourdough made with accelerated commercial processes or sourdough flavoring. The GI benefit of sourdough is real but modest — sourdough white bread still has a substantially higher GI than whole grain bread, and sourdough whole grain bread provides the benefits of both fermentation and intact grain structure. The most blood-sugar-favorable sourdough is made from whole grain or rye flour with genuine long fermentation.
- High-fiber commercial bread (GI 50–60 — variable): Several commercial bread brands produce breads specifically formulated to minimize glycemic impact through added fiber (oat bran, flaxseed, inulin) and reduced refined flour content. Brands like Dave’s Killer Bread, Ezekiel bread (sprouted grain), and Arnold Whole Grains bread provide 3–5g of fiber per slice with verified lower GI values. Sprouted grain breads (like Ezekiel) use the enzymatic changes during sprouting to partially break down phytates and modify starch structure, producing marginally lower GI than equivalent non-sprouted whole grain bread.
- White bread (GI 70–75 — high): Standard white bread — the most consumed bread type in the United States — is made from refined wheat flour with the bran and germ removed, leaving starch that is nearly as rapidly digested as pure glucose. The fortification of white bread with vitamins and minerals (required by law in the US) partially compensates for the nutrients lost in milling but does not restore the fiber, phytochemicals, or structural starch complexity that determines the bread’s glycemic impact. White bread consumed at typical sandwich quantities (two slices) represents a significant blood glucose load for adults managing diabetes, and its replacement with lower-GI whole grain alternatives is one of the most evidence-supported dietary modifications for improving long-term blood glucose control.

Reading Bread Labels for Blood Sugar Management
The supermarket bread aisle is one of the most confusing environments for adults managing bread and blood sugar, because bread marketing terminology systematically misleads even educated consumers about the actual nutritional content and blood sugar impact of bread products. Understanding how to decode bread labels accurately:
- “Wheat bread” and “wheat flour” mean refined white flour: In US food labeling, “wheat bread” and “wheat flour” refer to refined flour made from wheat — the same refined product used in standard white bread. The term “whole wheat” or “whole grain wheat” indicates that the whole grain kernel (bran + germ + endosperm) was used rather than refined flour. A bread labeled simply “wheat bread” with “enriched wheat flour” as the first ingredient contains predominantly refined white flour despite its brown color (often achieved through molasses or caramel coloring rather than whole grain content).
- Fiber content is the most reliable blood sugar proxy on the label: Since GI testing is not required on food labels, fiber content per serving is the most practical indicator of a bread’s likely glycemic impact. Less than 1g of fiber per slice = likely high GI (white-bread equivalent); 2–3g of fiber per slice = likely moderate GI (whole grain equivalent); 3–5g of fiber per slice = likely low-to-moderate GI (high-fiber formulation). Aiming for bread with at least 2g of fiber per slice establishes a practical minimum that significantly narrows the field to genuinely lower-GI products.
- Ingredient list position of whole grain flour: Ingredients are listed by weight, largest first. In a genuinely whole grain bread, “whole wheat flour” or “whole grain [grain name] flour” should be the first ingredient. If “enriched flour” or “unbleached flour” appears before “whole wheat flour,” the bread contains more refined flour than whole grain flour by weight — regardless of what the front label says about whole grains.
- Serving size manipulation: Some bread brands list nutrition facts for a single thin slice (25–30g) when most people eat two standard slices (40–50g each). Comparing nutrition facts across brands requires checking whether the stated serving size reflects realistic consumption. A bread with 12g of carbohydrates per slice sounds lower in carbohydrates than a bread with 22g per slice — but if the first bread’s slice is half the weight of the second bread’s slice, the carbohydrate density is identical. The complete guide on low-glycemic foods covers label-reading strategies across all food categories, and our best foods for blood sugar control guide contextualizes bread within the complete landscape of blood-sugar-influencing foods. The ADA’s nutrition resources, the NIDDK’s diabetes eating guidance, and the CDC’s diabetes prevention nutrition guidance all support choosing whole grain bread over refined white bread as one of the most achievable and impactful carbohydrate quality improvements for blood sugar management. The overall framework for integrating bread choices within a comprehensive blood-sugar-conscious dietary pattern is covered in our diabetes diet beginner’s guide.
How Bread Affects Blood Sugar: The Starch and Fiber Mechanism
Understanding why different breads produce such different bread and blood sugar responses requires a brief look at the starch and fiber mechanisms that determine how rapidly bread’s carbohydrates enter the bloodstream. White bread is made from refined flour — grain with the bran and germ removed — leaving the starchy endosperm that is almost entirely digestible by amylase enzymes. When white bread enters the small intestine, amylase encounters starch that has been fully gelatinized by baking (becoming highly accessible), with no fiber barrier, no intact grain structure, and no phytate or protein matrix slowing enzyme access. The result is rapid starch hydrolysis to glucose — complete within 30–60 minutes of consumption — producing the blood glucose spike characteristic of refined carbohydrate intake. Whole grain bread, by contrast, contains the intact bran layer surrounding the grain’s starch — this bran layer physically limits amylase access to the starch, slowing digestion rate. The soluble fiber in whole grains (particularly beta-glucan in oats and arabinoxylan in wheat and rye bran) forms viscous gels in the stomach that further slow gastric emptying and starch exposure to digestive enzymes. The combination of physical starch protection and viscous fiber-mediated gastric slowing reduces the rate of glucose delivery from whole grain bread to approximately half that of white bread from the same carbohydrate load — not by reducing the total glucose absorbed, but by spreading that glucose absorption over twice as long a period, producing a lower peak and more gradual blood glucose rise. This mechanism explains why eating white bread and whole grain bread with the same grams of carbohydrates produces such different blood glucose responses — it is not the total carbohydrate content but the rate of its delivery into the bloodstream that determines the blood glucose peak and the metabolic consequences of that peak. Understanding this mechanism also reveals why looking for bread with the highest fiber content — as a proxy for the most intact grain structure and the most viscous-fiber content — is the most reliable strategy for identifying blood-sugar-favorable bread options in a market full of confusing and often misleading labeling.
Practical Strategies for Bread and Blood Sugar Management
For adults committed to managing bread and blood sugar outcomes effectively while continuing to enjoy bread, several practical strategies significantly reduce bread’s blood glucose impact without requiring elimination:
- Switch the bread type first, worry about quantity second: The blood glucose difference between two slices of white bread and two slices of 100% whole grain or rye bread is larger than the difference between two slices and one slice of white bread. Switching bread type is a higher-impact intervention than reducing bread quantity — and it preserves the practical utility of bread in the diet (sandwiches, toast, wraps) while substantially lowering its blood glucose contribution. This sequencing — optimize type before restricting quantity — produces better dietary adherence because it maintains the cultural and practical role of bread in meals rather than requiring its reduction or elimination.
- Toast bread to lower its glycemic index: Toasting bread (converting some of the surface starch to a dextrinized form and reducing moisture content) slightly lowers its glycemic index — by approximately 5–10 GI points in most studies. This effect is modest but real, and toasting additionally firms the bread’s texture in a way that typically results in slower eating and smaller bite sizes, both of which independently reduce the rate of carbohydrate delivery. Toasting white bread does not convert it into a low-GI food, but it provides marginal improvement over untoasted white bread, and toasting 100% whole grain bread provides this modest additional benefit on top of the already-lower baseline GI.
- Build sandwiches around protein and non-starchy vegetables: The blood glucose impact of a sandwich depends not only on the bread type but on the total meal composition. A turkey, avocado, and vegetable sandwich on 100% whole grain bread produces a substantially lower blood glucose response than the same bread filled with high-carbohydrate spreads (jam, honey) or processed deli meat and cheese without vegetables — because the protein, fat, and fiber from non-starchy vegetables in the turkey-avocado sandwich collectively slow gastric emptying and moderate glucose absorption from the bread’s carbohydrates. Building every bread-based meal around substantial protein and non-starchy vegetable content is the practical meal-composition strategy that makes bread manageable within a blood-sugar-conscious diet.
- Limit to two slices (one serving) per meal: Even low-GI bread contributes meaningful carbohydrate loads at more than two slices. Two slices of 100% whole grain bread provide approximately 24–26g of carbohydrates — a meaningful but manageable carbohydrate allocation within most daily budgets. Three or four slices at a single meal (common with large sandwiches, multiple toast servings, or bread as a side alongside other carbohydrate-containing foods) pushes the bread’s glycemic load into ranges that challenge blood glucose management even for the most favorable bread varieties.
- Use bread as a vehicle for nutrient-dense toppings: Toast and bread are most blood-sugar-favorable when used as a base for nutrient-dense, protein-containing, and fiber-rich toppings rather than as the main nutritional component of a meal. Whole grain toast topped with avocado and eggs, almond butter and berries, or cottage cheese and tomato provides protein, healthy fat, and fiber alongside the bread’s carbohydrates — turning bread from a simple starch delivery mechanism into the base of a nutritionally complete meal that moderates its own blood glucose impact through the macronutrient composition of the complete dish. Our guide on glycemic index vs glycemic load provides the technical framework for understanding how bread type, portion size, and meal composition interact to determine actual blood glucose impact. The whole grains and blood sugar guide covers the evidence for whole grain bread alongside other whole grain foods as components of an evidence-based diabetes dietary pattern. The best foods for blood sugar control guide positions bread within the complete hierarchy of food choices for blood glucose management.
Bread Alternatives for Lowest Blood Sugar Impact
Adults seeking to minimize their bread and blood sugar impact further — or who need the lowest possible carbohydrate load from bread-format foods — have several alternatives that provide bread-like function at substantially lower glycemic impact:
- Lettuce wraps and vegetable-based wraps: Large lettuce leaves (romaine, butter lettuce, iceberg), collard green leaves, and nori sheets can wrap sandwich fillings with negligible carbohydrate contribution — effectively eliminating the bread entirely while maintaining the sandwich format and hand-held convenience. Lettuce wraps are a lower-calorie, lower-carbohydrate alternative appropriate for adults following very low-carbohydrate approaches.
- Almond flour and coconut flour bread (GI approximately 0–5): Bread made from almond flour, coconut flour, or a combination of these with eggs and fat contains minimal digestible carbohydrates — typically 3–6g of net carbohydrates per slice compared to 12–15g for standard bread. Commercial almond flour breads and coconut flour breads are available in most health food stores and increasingly in mainstream supermarkets, providing bread texture and function with near-zero blood sugar impact. The trade-off is significantly higher caloric density (due to high fat content from nuts and eggs) and a different flavor and texture profile than wheat bread.
- Protein bread and high-fiber bread (GI 30–45): Several commercial bread brands have developed breads with exceptionally high protein content (10–15g per slice from added wheat protein isolate, pea protein, or egg white) and high fiber content (5–8g per slice from added oat fiber, chicory root fiber, or psyllium husk) that produce very low glycemic indices despite containing wheat. These products — marketed as protein bread, keto bread, or high-fiber bread — are the most practically accessible “bridge” option for adults who want bread with minimal blood sugar impact but who find almond flour or lettuce wrap alternatives unsatisfying as bread substitutes. The complete picture of how bread fits within the broader dietary strategy for blood sugar management is provided in our diabetes diet beginner’s guide, which integrates bread choices with all other carbohydrate sources — rice, oatmeal, legumes, fruits, and vegetables — within a comprehensive nutritional framework for sustained glucose control and metabolic health.
How Many Slices of Bread Are Safe per Day for Blood Sugar?
For bread and blood sugar management, there is no universally safe number of bread slices per day — the appropriate quantity depends on the bread type chosen, the individual’s overall carbohydrate budget, other foods consumed at the same meals, and personal blood glucose monitoring data. However, general evidence-based guidelines provide useful parameters for most adults managing glucose levels. Adults following a moderate carbohydrate approach (130–180g of carbohydrates per day) can typically accommodate two to four slices of 100% whole grain bread across the day — one to two slices at two different meals — within a carbohydrate budget that allows room for vegetables, legumes, fruit, and one or two other grain servings. Each two-slice serving (approximately 24–26g of carbohydrates from whole grain bread) represents a manageable carbohydrate portion with the fiber and protein content that moderates its glycemic impact relative to the equivalent carbohydrate load from white bread. Adults following very low-carbohydrate approaches (below 50g per day) may find that even one or two slices of low-GI bread uses a significant fraction of their daily carbohydrate budget and may prefer almond flour alternatives or lettuce wraps for minimal blood sugar impact. Adults using continuous glucose monitoring can directly evaluate whether their chosen bread type and portion fits within their personal acceptable postprandial glucose range — empirically confirming the right bread and quantity for their individual metabolic context rather than relying on population-level GI averages alone. The ADA’s diabetes nutrition guidance at diabetes.org/food-nutrition emphasizes individualized carbohydrate management as the most reliable approach for adults with diverse metabolic profiles and varying treatment approaches.
Sources: American Diabetes Association — carbohydrate quality and blood glucose management; NIDDK — diabetes diet guidance; International GI database — glycemic index values for bread types; research on sourdough fermentation and glycemic index reduction; whole grain consumption and Type 2 diabetes risk meta-analysis; Food and Drug Administration — whole grain labeling requirements and ingredient list interpretation.
This is one of the clearest explanations of bread and blood sugar I have found. The specific numbers and thresholds mentioned are exactly what I needed to understand my results. Thank you for making complex medical information accessible without dumbing it down.
I have been reading about bread and blood sugar for weeks and this is the most thorough guide I found. The connection between lifestyle choices and long-term outcomes is explained clearly here. Looking forward to reading more articles from this website.
Thank you for covering bread and blood sugar so thoroughly without being overly technical. The section on managing this condition day-to-day was especially useful for planning. This is going into my health folder that I bring to every doctor’s visit.