
A1C vs Blood Glucose: What Is the Difference?
Two measurements sit at the center of diabetes diagnosis and management: A1C vs blood glucose. Both measure aspects of blood sugar, both appear on lab reports and clinical discussions, and both are used to diagnose and track diabetes — yet they measure fundamentally different things, have different strengths and limitations, and are used in different clinical contexts. Understanding what each test measures, what the numbers mean, when one is more informative than the other, and how they work together gives a far more complete picture of metabolic health than either test provides alone. This guide explains the distinction clearly, with enough physiological context to make the comparison genuinely meaningful rather than superficial. For the broader reference framework that includes both measurements, see our guide on what is normal blood sugar. For an in-depth look at the A1C test specifically, our guide on the A1C test provides the full picture.
What Blood Glucose Measures
A blood glucose test measures the concentration of glucose dissolved in the blood at the moment the blood sample is taken. The result is a snapshot — a single data point that reflects the glucose level right now, or at the specific time the test was performed. This real-time quality is both the primary strength and the primary limitation of blood glucose testing: it is immediately responsive to what is happening in the body at that instant, but it tells you nothing about what was happening yesterday, last week, or over the past three months.
Blood glucose can be measured in several ways. A home capillary glucose meter uses a fingertip blood drop applied to a test strip — results in 5 seconds, accurate within approximately ±15% of the true plasma value. A laboratory venous plasma glucose test draws blood from a vein and measures glucose in a certified laboratory — more accurate than home meters and used for clinical diagnosis. A continuous glucose monitor (CGM) uses a sensor inserted under the skin to measure interstitial glucose (the glucose in the fluid between cells) every one to five minutes — providing a real-time graph of glucose throughout the day and night rather than single-point readings. Each of these methods is measuring the same thing — the concentration of glucose in or near blood — but with different accuracy, timing, and practicality.
The clinical interpretation of blood glucose depends critically on when it is taken. A fasting glucose (taken after eight or more hours without eating) reflects overnight hepatic glucose production and the insulin response that suppresses it — as explained in detail in our guide on fasting blood sugar explained. A post-meal glucose (taken one to two hours after eating) reflects how well the body clears the glucose absorbed from that meal — covered in depth in our guide on post-meal blood sugar explained. A random glucose (taken at any time without regard to meals) has less precise reference ranges but can still be diagnostically significant at very high values. The same glucose meter reading of 150 mg/dL can be reassuring (post-meal, below the 180 mg/dL diabetes management target), borderline concerning (fasting, above the 126 mg/dL diabetes threshold), or diagnostically significant (random, combined with symptoms). Context determines meaning. Understanding how the body controls blood sugar throughout the day clarifies why timing matters so much when interpreting a glucose reading.
What A1C Measures
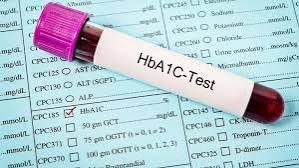
The A1C test (hemoglobin A1C, HbA1c, glycated hemoglobin) measures something fundamentally different from a blood glucose reading: it measures the percentage of hemoglobin molecules in the blood that have glucose chemically attached to them. Glucose attaches to hemoglobin through a process called glycation — a spontaneous, non-enzymatic chemical reaction that occurs continuously in the blood. The higher the blood glucose concentration over time, the more glucose attaches to hemoglobin molecules. Because red blood cells (which contain hemoglobin) circulate for approximately 90–120 days before being broken down, the A1C reflects the cumulative glycation that has occurred over that full period — effectively an integrated average of blood glucose over the past two to three months.
The A1C result is reported as a percentage: an A1C of 7% means 7 out of every 100 hemoglobin molecules carry a glucose attachment. Because this is a chemical property of hemoglobin rather than a measurement of dissolved glucose concentration, A1C does not require fasting — the sample can be taken at any time of day, with or without a recent meal, and the result will be the same (reflecting the past months, not the past hour). This practical advantage makes A1C easier to obtain consistently than fasting glucose, and it is why A1C has become the standard long-term monitoring tool in established diabetes management. The detailed mechanism, limitations, and clinical use of the A1C test is covered in our guide on the A1C test.
The Core Difference: Snapshot vs. Average
The fundamental distinction between A1C and blood glucose can be summarized in one pair of concepts: blood glucose is a snapshot; A1C is an average. Each has irreplaceable value, and each has significant blind spots that the other compensates for.
Blood glucose as a snapshot: A blood glucose reading tells you exactly what glucose was at one specific moment. This is precisely what is needed for real-time management decisions — deciding how much insulin to inject before a meal, confirming that a low glucose reading explains current symptoms, checking whether blood sugar has responded to a correction dose, or verifying that glucose is safe before exercise or sleep. No amount of A1C information can replace blood glucose for these moment-to-moment decisions. A person using insulin needs to know what their glucose is right now — not what their average has been over the past three months — to make the next insulin dosing decision safely. Home glucose monitoring as described in our guide on home blood sugar monitoring is the tool that provides this snapshot capability at home.
A1C as an average: The A1C provides what blood glucose cannot: a summary of glucose exposure over an extended period that is not affected by the glucose level at any single moment. A person who had an unusually stressful week with high glucose readings, or who had a recent illness that temporarily elevated glucose, will not have a meaningfully different A1C from those brief episodes — the A1C average across the prior two to three months absorbs short-term fluctuations. Conversely, a person who improves their diet and exercise program the week before a clinic appointment will not see an improvement in their A1C from that week alone — the improvement will only show if maintained across weeks. This stability and resistance to short-term variation makes A1C the most reliable marker of long-term glucose control and complication risk, which is why it is the primary outcome measure in diabetes management guidelines and clinical trials.
- What it measures: Blood glucose = dissolved glucose right now | A1C = % hemoglobin glycated over ~3 months
- Time window: Blood glucose = seconds to minutes ago | A1C = past 2–3 months
- Fasting required: Blood glucose (fasting) = yes | A1C = no
- Used for real-time decisions: Blood glucose = yes | A1C = no
- Affected by recent meal: Blood glucose = yes | A1C = no
- Detects glucose variability: Blood glucose (CGM) = yes | A1C = no — averages hide spikes and lows
- Affected by anemia/hemoglobin variants: Blood glucose = no | A1C = yes
- Primary use: Blood glucose = day-to-day management | A1C = long-term tracking and diagnosis
Diagnostic Thresholds: How Each Is Used for Diagnosis
Both A1C and blood glucose are used in the diagnostic criteria for prediabetes and diabetes, with the same clinical weight — either test can establish a diagnosis when results are in the diagnostic range on confirmed testing. The specific thresholds are:
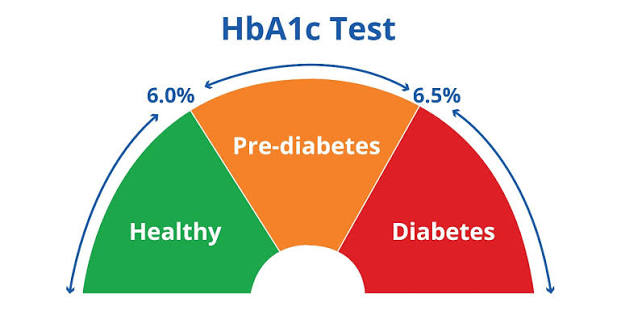
- Normal: Fasting glucose below 100 mg/dL OR A1C below 5.7%
- Prediabetes: Fasting glucose 100–125 mg/dL OR A1C 5.7–6.4% (or 2-hour OGTT glucose 140–199 mg/dL)
- Diabetes: Fasting glucose 126+ mg/dL on two occasions OR A1C 6.5%+ confirmed OR 2-hour glucose 200+ mg/dL OR random glucose 200+ mg/dL with symptoms
An important nuance is that these two tests do not always agree. A person with a normal fasting glucose may have an A1C in the prediabetes range — particularly if their post-meal glucose spikes are high enough to increase average glucose even without elevating the fasting level. Conversely, someone may have a fasting glucose in the prediabetes range while their A1C is still technically normal, if their post-meal glucose clearance is adequate and the overall average is not elevated. These discordant results are relatively common — studies suggest that fasting glucose and A1C agree in categorizing people as normal, prediabetes, or diabetes in approximately 70–80% of cases, with meaningful discordance in the remaining 20–30%. When test results disagree, clinical judgment about which test is more reliable in a specific individual, and whether additional testing (such as an oral glucose tolerance test) is needed to resolve the discrepancy, becomes important. For a comprehensive look at the range of blood sugar tests used for diagnosis, see our guide on the oral glucose tolerance test and the random blood sugar test.
When Blood Glucose Is More Informative Than A1C
Several clinical situations favor blood glucose measurement over A1C as the primary or most informative test.
Real-time management decisions: As discussed above, no long-term average can replace the real-time reading needed for insulin dosing, hypoglycemia management, and safety decisions around exercise, driving, and sleep. People managing diabetes with insulin rely on blood glucose readings — from meters or CGM — many times daily to make dosing decisions that cannot wait for a laboratory appointment. A1C results at quarterly visits contextualize the overall trajectory but provide no guidance for what to do right now.
Acute clinical settings: In emergency rooms, intensive care units, and during surgery, blood glucose is the relevant measurement for acute hyperglycemia management — because what matters in these settings is the current glucose level, not the average over the past three months. Intravenous insulin titration in critically ill patients uses frequent blood glucose measurements (sometimes hourly) to maintain glucose in target range acutely. A1C provides no useful information for these immediate clinical decisions.
Conditions that falsify A1C: Several common conditions make A1C unreliable as a glucose measure — iron deficiency anemia (falsely elevates A1C), hemolytic anemias (falsely lowers A1C), sickle cell trait and other hemoglobin variants (may interfere with some A1C measurement methods), and recent blood transfusion (changes the red blood cell pool that A1C reflects). In patients with these conditions, fasting glucose and post-meal glucose testing provide more accurate glucose assessment than A1C. For context on what these conditions mean for blood sugar assessment in affected individuals, this is an important limitation to discuss with a healthcare provider. Our guide on diabetes risk factors discusses population-specific considerations in diabetes screening.
Post-meal glucose spikes not captured by A1C: A person can have post-meal glucose that regularly spikes to 200–250 mg/dL while their fasting glucose remains normal and their A1C stays below 6.5% — if the spikes are brief enough and fasting glucose is low enough that the overall average remains under the diabetes threshold. Yet those post-meal spikes still expose blood vessel walls and organs to hyperglycemia and generate oxidative stress. Blood glucose measurement — particularly CGM that shows the full post-meal profile — can detect these spikes that A1C mathematically obscures. This is why post-meal glucose testing is the most sensitive test for early insulin resistance, and why the combination of A1C plus post-meal glucose gives a more complete picture than A1C alone.
When A1C Is More Informative Than Blood Glucose
A1C has its own advantages that make it the superior measurement in specific situations.
Long-term complication risk assessment: The landmark trials that established the relationship between glucose control and complication risk — DCCT for Type 1, UKPDS for Type 2 — both used A1C as the primary measure of glucose control. The evidence base for diabetes complication prevention is built on A1C targets, not on daily blood glucose readings. When assessing the long-term trajectory of diabetes management and its impact on eyes, kidneys, and nerves, A1C is the most directly relevant measure because it is what the clinical evidence is based on.
Screening convenience: A1C can be tested at any time of day without fasting preparation. For population screening programs and routine annual labs where fasting is inconvenient, A1C provides a reliable screen without the logistical requirement of an eight-hour overnight fast. This makes it more consistently obtainable across diverse clinical settings and more suitable for opportunistic screening (testing during a non-fasting medical visit) than fasting glucose.
Detecting long-term patterns not visible in individual glucose readings: A person who tests their blood glucose only once or twice a day — at fasting and before dinner, for instance — may be missing the post-meal glucose spikes that occur between those testing times. The A1C integrates glucose exposure across all time periods, including the times between home testing measurements, providing a check on whether the glucose readings being captured at home are representative of overall control or are a selected sample that misses significant elevations. When A1C is higher than expected based on home glucose readings, it often signals that there are glucose elevations happening at times not being tested — typically post-meal periods or overnight. Our guide on how often blood sugar should be checked covers strategies for selecting testing times that provide the most complete picture of glucose patterns.
Monitoring treatment response over time: When starting a new diabetes medication, making a major dietary change, or significantly increasing physical activity, the response unfolds over weeks to months. Blood glucose readings will begin to improve within days, but whether the improvement is sustained and sufficient to meaningfully reduce A1C — and therefore long-term complication risk — takes a full A1C testing cycle (three months) to confirm. For people and clinicians evaluating whether a management change has truly succeeded, the A1C at three months after the change provides the definitive answer that daily glucose readings cannot. For detailed context on the full range of blood sugar monitoring methods and how to choose between them for individual situations, our guide on home blood sugar monitoring provides a practical decision framework. And for understanding the specific patterns of high blood sugar that both measurements are trying to detect and manage, our guide on early signs of high blood sugar describes the symptom picture that elevated glucose produces across different testing contexts.
Converting Between A1C and Average Blood Glucose
Because A1C and blood glucose measure related but different things, clinicians and researchers have developed conversion formulas that allow one to be estimated from the other. The most widely used formula, derived from the ADAG study (A1C-Derived Average Glucose), estimates average glucose from A1C with the following relationship: estimated average glucose (eAG) in mg/dL equals 28.7 multiplied by A1C minus 46.7. Applying this formula, an A1C of 6.0% corresponds to an estimated average glucose of approximately 126 mg/dL; an A1C of 7.0% corresponds to approximately 154 mg/dL; an A1C of 8.0% to approximately 183 mg/dL; and an A1C of 9.0% to approximately 212 mg/dL.
The eAG concept is useful because it translates the percentage-based A1C into the same units (mg/dL) that home glucose meters display, making it more intuitive for people who monitor their glucose daily. Many laboratory reports now include the eAG alongside the A1C percentage for exactly this reason — it helps bridge the conceptual gap between the two measurements. However, the conversion carries uncertainty: the standard deviation in the ADAG study was approximately 15 mg/dL, meaning the estimated average glucose can be off by that amount in either direction in any individual. The relationship holds well at the population level but is less precise for a specific individual, which is why the eAG is most useful for general education and context rather than for precise clinical decision-making.
It is also important to understand that the estimated average glucose from A1C does not map directly to what a person would observe averaging their home glucose readings. Home glucose readings are typically taken at structured times — fasting, before meals, two hours after meals — and may systematically miss overnight periods or times of the day when glucose follows a different pattern. A person who tests only at fasting and pre-dinner times may consistently measure glucose in ranges that look good, while their post-meal glucose spikes that occur between testing times raise their A1C. Conversely, a person whose home testing captures post-meal peaks may observe average home readings that appear higher than the eAG estimated from their A1C, if their glucose returns to normal between the testing windows that their home schedule captures. These divergences between home monitoring averages and A1C-based estimates are common and are one reason that A1C provides information that home glucose monitoring does not fully substitute for — the two measurements complement each other rather than being interchangeable.
Glucose Variability: What Neither A1C Nor Single Blood Glucose Captures
Both A1C and any individual blood glucose reading have a blind spot that has become increasingly recognized as clinically important: neither captures glucose variability — the degree to which blood glucose fluctuates between highs and lows throughout the day. Two people can have identical A1C values and identical average glucose readings, yet one may have relatively stable glucose (staying primarily in the 100–160 mg/dL range throughout the day) while the other experiences dramatic swings (fluctuating between 60 mg/dL and 300 mg/dL, averaging out to the same overall value). The A1C will not distinguish these two patterns — the mathematical average is the same regardless of variability.
This matters because glucose variability itself is a biological stressor. Post-meal glucose spikes trigger oxidative stress and inflammatory responses in blood vessel walls even when the average glucose is well-controlled. Frequent hypoglycemia episodes (even if brief) can cause counter-regulatory hormone responses that then drive rebound hyperglycemia, creating a cycle of instability. High variability is associated with increased risk of cardiovascular events, and some evidence suggests it may predict complications risk independently of the average glucose level reflected by A1C. The metric used to capture this variability is called time-in-range — the percentage of time glucose stays within a defined target range (typically 70–180 mg/dL for most people with diabetes). Time-in-range can only be measured with continuous glucose monitoring (CGM), which records glucose every one to five minutes throughout the day and night, providing thousands of data points per day rather than the handful provided by a traditional glucose meter. As CGM technology has become more accessible, time-in-range has emerged as a third measurement domain — alongside A1C and blood glucose — that provides information about the shape of the glucose curve rather than just its average or any individual snapshot value.
For practical purposes, the hierarchy of measurement tools can be thought of as: A1C provides the long-term average; home blood glucose monitoring provides structured snapshots at clinically defined times; and CGM provides the full continuous picture including variability and time-in-range. The complete picture — understanding what blood sugar is and how it behaves throughout the day — is best achieved by using the combination of measurement tools that is appropriate for the individual’s clinical situation. For most people with established diabetes on insulin or other glucose-lowering medications, using a home glucose meter at structured times combined with quarterly A1C testing provides a practical and informative monitoring approach. For people with highly variable glucose, those experiencing frequent hypoglycemia, or those wanting the most detailed picture of their glucose patterns, CGM adds the continuous dimension that discrete testing cannot provide.
Practical Implications: How to Use Both Measurements Together
Understanding the distinct roles of A1C and blood glucose leads naturally to a practical framework for using both measurements together most effectively. The key principle is that they answer different questions — and asking both questions gives the most complete picture of glucose health.
Use blood glucose for real-time management decisions: Pre-meal glucose determines whether an insulin dose should be adjusted before eating. Post-meal glucose confirms whether the dose and meal were well-matched. A glucose reading before exercise informs whether it is safe to start. A glucose reading before driving or before sleep confirms it is safe to proceed. For these moment-to-moment decisions, blood glucose from a meter or CGM is indispensable — A1C cannot substitute for it. Following the structured approach described in our guide on how often blood sugar should be checked ensures that the most clinically important glucose patterns are captured in a sustainable home monitoring routine.
Use A1C for long-term trajectory and treatment assessment: Is this management plan working? Has the dietary change made a difference over the past three months? Is the new medication reducing average glucose? Has the A1C improved enough to reduce complication risk? These questions are answered by A1C, not by any individual blood glucose reading. A quarterly A1C test at clinical visits provides the long-term summary that contextualizes what home monitoring has been showing, confirms whether short-term improvements are sustained, and provides the outcome data that informs treatment decisions. For understanding why these long-term glucose averages matter so profoundly for health outcomes, our guide on why blood sugar matters for long-term health explains the mechanisms by which elevated glucose damages blood vessels, kidneys, eyes, and nerves over time — and why sustained A1C improvement translates directly into reduced risk of these complications.
Investigate when A1C and home readings diverge: When A1C is higher than expected based on home glucose readings, it usually means glucose is elevated at times that home testing is not capturing — most commonly post-meal periods or overnight. When A1C is lower than expected, it may mean home testing is over-representing high readings (perhaps testing preferentially when symptomatic) or that there is a condition affecting A1C reliability. Either discrepancy is worth investigating with more comprehensive glucose testing — either more frequent fingerstick testing at different times of day, or a trial period of CGM — to identify the pattern that the combination of A1C and partial home monitoring is not fully revealing. The full picture comes from combining what both measurements show.
Sources: American Diabetes Association. Standards of Medical Care in Diabetes — 2024. Diabetes Care. 2024;47(Suppl 1):S20–S42. • Selvin E, et al. Glycated Hemoglobin, Diabetes, and Cardiovascular Risk. Ann Intern Med. 2010;152(9):567–574. • National Institute of Diabetes and Digestive and Kidney Diseases. The A1C Test and Diabetes. NIDDK; 2023.
Finally a resource that explains a1c vs blood glucose: what is in plain language. The connection between lifestyle choices and long-term outcomes is explained clearly here. This gave me real confidence going into my next specialist appointment.
Bookmarked this article on a1c vs blood glucose: what is immediately — going to reference it regularly. What I liked most was that the article didn’t just say what to avoid — it also gave alternatives. Keep up this kind of thorough health journalism — it genuinely helps patients like me.
Came across this while researching a1c vs blood glucose: what is for a family member. The article answered questions I didn’t even know I had until I started reading. Exactly the kind of evidence-based information that is hard to find in one place.