
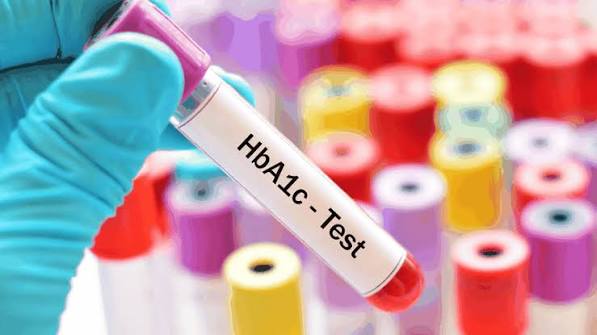
A1C Test: What It Means for Your Blood Sugar
The A1C test — also called hemoglobin A1C, HbA1c, or glycated hemoglobin — is the single most widely used measurement for both diagnosing diabetes and monitoring blood sugar control over time. Unlike a fasting glucose test that captures one moment in time, the A1C reflects average blood glucose over the preceding two to three months, making it a more stable and comprehensive picture of how well glucose has been controlled through the highs and lows of daily life. Understanding what the A1C percentage means, what different values indicate about metabolic health, and how the test should be used in the context of diabetes management is essential for anyone with diabetes, prediabetes, or elevated glucose risk. For the broader context of how A1C fits within the full range of blood sugar measurements, our guide on what is normal blood sugar provides a comprehensive overview of all testing types and ranges. And for understanding the physiological basis of blood glucose regulation that A1C reflects, our guide on how the body controls blood sugar provides the foundational context.
What the A1C Test Actually Measures
Hemoglobin is the protein inside red blood cells that carries oxygen throughout the body. When blood glucose is elevated, glucose molecules attach to hemoglobin through a process called glycation — a non-enzymatic chemical reaction in which glucose binds to the amino acid valine at the end of the hemoglobin beta chain, forming glycated hemoglobin (HbA1c). This glycation is cumulative and essentially irreversible during the red blood cell’s lifespan — once glycated, the hemoglobin molecule remains glycated until that red blood cell is broken down at the end of its life. The amount of glycated hemoglobin at any point in time therefore reflects the average blood glucose concentration to which those red blood cells have been exposed during their lifespan.
Red blood cells live approximately 90–120 days in the circulation, which is why the A1C reflects average blood glucose over approximately two to three months. The measurement is reported as a percentage of total hemoglobin that is glycated: an A1C of 7% means 7% of hemoglobin molecules are carrying glucose. Higher blood glucose levels throughout the preceding months result in more glycation and a higher A1C percentage. This relationship is reliably proportional: each 1% change in A1C corresponds to an average blood glucose change of approximately 28–30 mg/dL. Understanding what blood sugar is and how it relates to the A1C measurement helps translate the abstract percentage into a concrete picture of glucose exposure over time.
The A1C test is performed on a standard blood sample drawn from a vein — the same blood draw used for other routine laboratory tests. It does not require fasting. Point-of-care A1C testing (finger-stick tests that provide results in minutes) is available in some clinical settings, though laboratory-based testing is slightly more accurate and is preferred for establishing a new diagnosis. Home A1C testing kits are also available over the counter, though these have wider accuracy ranges than laboratory testing and are better used for general tracking than for formal diagnosis.
A1C Ranges: Normal, Prediabetes, and Diabetes
The American Diabetes Association defines the following A1C categories:
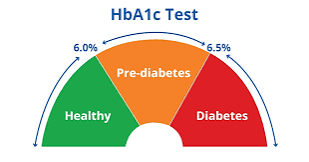
- Normal: Below 5.7%. An A1C below 5.7% indicates that average blood glucose over the past two to three months has been in the healthy range. This corresponds to an estimated average glucose (eAG) of approximately 117 mg/dL or below. People with A1C in this range have normal glucose regulation and no current evidence of prediabetes or diabetes.
- Prediabetes: 5.7–6.4%. An A1C in this range indicates elevated average glucose consistent with prediabetes — the intermediate state of impaired glucose regulation between normal and diabetes. Risk of progressing to Type 2 diabetes increases with A1C level within this range: at 5.7–6.0%, the annual progression rate to diabetes is approximately 5%; at 6.0–6.4%, it rises to 15–20% per year. Prediabetes is often reversible with lifestyle modification. Our guide on what prediabetes is covers the significance of this diagnosis and what steps can reduce the risk of progression.
- Diabetes: 6.5% or above. An A1C of 6.5% or higher, confirmed on a repeat test or alongside other diabetes diagnostic criteria, meets the diagnostic threshold for diabetes mellitus. This corresponds to an estimated average glucose of approximately 140 mg/dL or above. An A1C of 6.5% on two separate occasions is sufficient for diagnosis without additional testing — unless symptoms of hyperglycemia are present, in which case a single A1C above 6.5% plus symptoms may be sufficient.
For people already diagnosed with diabetes who are in active management, the treatment target A1C is below 7.0% for most non-pregnant adults — a value that reflects the point at which the risk of long-term complications is substantially reduced while maintaining a manageable risk of hypoglycemia. Some individuals may have tighter targets (below 6.5%) if they have a long life expectancy, can achieve tight control without frequent hypoglycemia, and are highly motivated. Others may have more lenient targets (7.5–8.0%) if they have frequent hypoglycemia, limited life expectancy, extensive comorbidities, or longstanding diabetes with established complications where the benefit of very tight control is more limited.
- Below 5.7%: Normal — healthy average glucose regulation
- 5.7–6.4%: Prediabetes — elevated risk, often reversible with lifestyle change
- 6.5% or above: Diabetes — confirmed on repeat testing or with symptoms
- Target in diabetes management: Below 7.0% for most adults (individualized)
- A1C 7% ≈ average glucose of 154 mg/dL; each 1% = ~28–30 mg/dL average change
- Testing frequency: Every 3 months if not at target; every 6 months when stable at goal
A1C Limitations: What It Can and Cannot Tell You
The A1C test is highly valuable but has important limitations that should be understood when interpreting results.
It reflects an average, not variability: An A1C of 7.0% could reflect glucose that is consistently stable in the 140–160 mg/dL range, or it could reflect glucose that swings between 40 mg/dL and 280 mg/dL with a mathematical average of 154 mg/dL. The A1C cannot distinguish between these two very different patterns. The consistently stable pattern is far better for long-term health — glucose variability itself, independent of average glucose, is associated with increased oxidative stress and cardiovascular risk. Continuous glucose monitoring (CGM) addresses this limitation by capturing time-in-range data (the percentage of time glucose stays between 70 and 180 mg/dL), which provides information about variability that A1C cannot. Both metrics together — A1C for average and CGM for variability — provide the most complete picture of glucose control.
Conditions that falsely alter A1C: Because A1C reflects hemoglobin glycation, anything that changes the lifespan or composition of red blood cells can alter the A1C independently of actual blood glucose. Hemolytic anemias (in which red blood cells are destroyed faster than normal) produce falsely low A1C, because the shorter-lived cells have less time to accumulate glycation. Iron deficiency anemia produces falsely high A1C. Certain hemoglobin variants (sickle cell trait, hemoglobin C) interfere with some A1C measurement methods, producing falsely abnormal results. In populations or individuals with these conditions, alternative measures — fasting glucose, post-meal glucose, or fructosamine testing — provide more reliable glucose assessment than A1C. This limitation is clinically significant for populations with high prevalence of sickle cell trait (predominantly those of African, Mediterranean, or Middle Eastern descent), where A1C results should be interpreted with awareness of the potential for variant hemoglobin interference.
It lags behind recent changes: The two-to-three-month averaging window of A1C means it responds slowly to recent changes in glucose control — improvements or deteriorations in the past four to six weeks are only partially reflected in the current A1C. Someone who dramatically improved their glucose control last month will not yet see the full benefit in their current A1C. This lag makes A1C less useful for detecting very recent changes and less responsive to week-to-week management adjustments. Home glucose monitoring — described in our guide on home blood sugar monitoring — provides real-time feedback on recent glucose changes that A1C cannot.
A1C and Long-Term Diabetes Complications
The clinical significance of the A1C target in diabetes management is grounded in landmark clinical trials that directly established the relationship between A1C level and the risk of diabetes complications. The DCCT (Diabetes Control and Complications Trial) in Type 1 diabetes and the UKPDS (United Kingdom Prospective Diabetes Study) in Type 2 diabetes both demonstrated that lowering A1C significantly reduces the risk of microvascular complications — diabetic retinopathy, nephropathy, and neuropathy — in a dose-dependent fashion. Each 1% reduction in A1C in Type 1 diabetes reduced the risk of retinopathy progression by 35–40% and the risk of kidney disease by 25–35%. These findings established A1C as the primary benchmark for long-term diabetes complication risk assessment.
The relationship between A1C and macrovascular complications (cardiovascular disease) is more complex. While epidemiological studies show that A1C is associated with cardiovascular risk, clinical trials of intensive glucose lowering in Type 2 diabetes have shown mixed results — very aggressive reduction of A1C (to below 6.5%) in older adults with established cardiovascular disease did not reduce cardiovascular events and in some studies slightly increased mortality, likely through increased rates of severe hypoglycemia. The current consensus is that moderate A1C improvement (to below 7.0% or 7.5% for most people) provides meaningful cardiovascular risk reduction, while very aggressive lowering in certain populations carries risks that may outweigh benefits. This nuance — that lower is not always better when it comes to A1C in all patients — reflects the complexity of diabetes management as a field and the importance of individualized treatment targets rather than one-size-fits-all goals. For a broader understanding of why blood sugar control matters for long-term health across multiple organ systems, our guide on why blood sugar matters for long-term health covers the full spectrum of complications that chronically elevated glucose produces and the evidence base for management. The A1C is one key input into that management — alongside fasting glucose, post-meal glucose, blood pressure, lipids, and kidney function — in the comprehensive approach to diabetes care that prevents complications most effectively. For a visual reference of all blood sugar ranges, including how A1C fits alongside fasting and post-meal values, see our blood sugar chart for adults.
How Often to Get an A1C Test
The recommended frequency of A1C testing depends on whether diabetes has been diagnosed and, if so, how well-controlled it is.
People without diabetes and no risk factors: Screening A1C (or fasting glucose) every three to five years starting at age 35, per U.S. Preventive Services Task Force guidance for overweight and obese adults. Those with risk factors — family history of diabetes, prior gestational diabetes, prediabetes history, or cardiovascular risk factors — should be screened annually regardless of weight.
People with prediabetes: Annual A1C and fasting glucose testing to monitor for progression. Prediabetes detected by A1C in the 5.7–6.4% range that is actively managed with lifestyle change may improve — and confirmation of improvement (A1C returning below 5.7%) provides important positive feedback that the intervention is working. Progression above 6.5% would indicate transition to diabetes requiring treatment escalation.
People with diabetes who are not at their A1C goal: Every three months. Quarterly A1C allows timely assessment of whether a management change (new medication, dietary adjustment, increased activity) is producing the intended glucose improvement. Since the A1C reflects the past two to three months, a quarterly test captures one complete A1C averaging window, giving the most responsive assessment of recent control.
People with diabetes who are stable at their A1C goal: Every six months. Once stable at goal, less frequent testing is sufficient — the twice-yearly schedule still detects deterioration in control that may develop from factors like medication tolerance, weight gain, or reduced activity, while avoiding unnecessary testing in those who are well managed.
In practice, A1C testing is typically done at regularly scheduled diabetes care appointments — making it easier to incorporate into the rhythm of clinical visits than as a standalone test. Knowing the A1C result in advance of a clinical visit allows preparation for more specific questions about what the value means and what adjustments might be appropriate if it is not at target. Combining the A1C result with recent home glucose meter logs or continuous glucose monitoring data — as described in our guide on home blood sugar monitoring — gives the most complete picture of glucose control and the most productive basis for a clinical discussion. A1C trending downward while home readings are improving confirms that the management plan is working; A1C unexpectedly elevated despite apparently good home readings may signal meter accuracy issues, unrecognized high overnight readings, or post-meal peaks that the meter is not capturing.
Converting A1C to Estimated Average Glucose (eAG)
Because the A1C is reported as a percentage that many patients find less intuitive than a blood glucose value in mg/dL, the American Diabetes Association adopted the estimated average glucose (eAG) conversion as a complementary reporting tool. The eAG translates the A1C percentage into the familiar mg/dL units that patients see on their home meters, making the A1C result more immediately relatable to day-to-day glucose experiences.
The conversion formula is: eAG (mg/dL) = 28.7 × A1C% − 46.7. Using this formula:
- A1C 5.0% = ~97 mg/dL average
- A1C 5.7% = ~117 mg/dL average (prediabetes lower boundary)
- A1C 6.0% = ~126 mg/dL average
- A1C 6.5% = ~140 mg/dL average (diabetes diagnostic threshold)
- A1C 7.0% = ~154 mg/dL average (typical management target)
- A1C 8.0% = ~183 mg/dL average
- A1C 9.0% = ~212 mg/dL average
- A1C 10.0% = ~240 mg/dL average
These eAG values represent weighted averages across all times of day — fasting, post-meal, overnight — with post-meal periods contributing proportionally more to the average because glucose is typically higher then than at other times. A person with an A1C of 7% has an eAG of approximately 154 mg/dL, but this does not mean their glucose is at 154 mg/dL at all times — it means the mathematical average across their full 24-hour glucose pattern over the past two to three months was approximately 154 mg/dL. A blood sugar chart for adults that includes both A1C and eAG values alongside the fasting and post-meal glucose ranges from our guide on what is normal blood sugar provides the complete reference table for interpreting glucose measurements across all formats and contexts. For anyone whose A1C suggests elevated average glucose alongside symptoms of elevated blood sugar — increased thirst, frequent urination, unexplained fatigue, blurry vision, or early signs of high blood sugar — prompt medical evaluation and discussion of treatment options is the appropriate next step. The A1C is the beginning of that conversation, not its end.
A1C vs. Fasting Glucose vs. Post-Meal Glucose: Which Matters Most?
Each of the three main glucose measurements — A1C, fasting glucose, and post-meal glucose — captures a different aspect of glucose metabolism and serves a different clinical purpose. Understanding their complementary roles prevents over-reliance on any single measurement and provides the most complete picture of metabolic health.
A1C is the most comprehensive summary — it reflects the accumulated glucose exposure over two to three months across all times of day and all glucose states (fasting, post-meal, and overnight). It is the best single measure for tracking long-term glucose control in established diabetes and for assessing the overall burden of glucose elevation. However, as discussed above, it cannot distinguish stable glucose from highly variable glucose, and it is susceptible to conditions that alter red blood cell lifespan. Fasting glucose measures a specific, well-defined metabolic state — overnight hepatic glucose production balanced against insulin suppression — and is particularly sensitive for detecting hepatic insulin resistance and glucose dysregulation in the fasting state. It is practical, requires no special testing protocol beyond the overnight fast, and correlates well with A1C for most people with moderate glucose elevation. Post-meal glucose is the most sensitive for detecting early insulin resistance, because post-meal glucose clearance is the first aspect of glucose regulation to fail as insulin sensitivity declines. It requires more complex testing (specific timing relative to meals) but provides information that neither fasting glucose nor A1C can offer about how well the body handles the glucose load of eating.
In clinical practice, the combination of all three provides the most complete assessment: A1C for the long-term summary, fasting glucose for the overnight regulatory state, and post-meal glucose for the meal-response capacity. Home glucose monitoring — described in our guide on home blood sugar monitoring — allows individuals to collect fasting and post-meal data routinely; A1C is then added at clinical visits to confirm whether the home data is representative of the full picture. For anyone wanting a comprehensive reference that brings all these measurements together with their diagnostic ranges and management targets, our blood sugar chart for adults provides a single-page overview. And for those tracking whether their glucose management is improving the full range of complications risk over time — beyond just glucose numbers — our guide on why blood sugar matters for long-term health explains what each improvement in A1C and glucose control actually means for organ health, quality of life, and longevity.
Racial and Ethnic Differences in A1C Interpretation
Research has identified systematic differences in A1C values between racial and ethnic groups that have important clinical implications for how A1C is interpreted across diverse populations. Studies using continuous glucose monitoring — which measures actual blood glucose levels independently of A1C — have found that for the same average blood glucose level, Black individuals tend to have A1C values approximately 0.4 percentage points higher than white individuals, and that some Asian populations may also show differences. The mechanism is thought to involve differences in hemoglobin glycation rates between individuals with different hemoglobin variants or red blood cell characteristics, rather than differences in actual blood glucose.
The practical implication is that A1C may systematically overestimate average blood glucose in Black individuals compared to white individuals — a finding with potential consequences for both diagnosis (more people may be classified as having prediabetes or diabetes based on A1C alone when their actual glucose is lower) and management (treatment intensification driven by higher A1C may not always reflect truly higher glucose). Current ADA guidelines recommend that clinicians be aware of these potential differences and use glucose-based measurements alongside or instead of A1C in populations where systematic differences have been identified, particularly when making diagnostic or treatment escalation decisions based solely on A1C. This is an evolving area of research, and clinical guidance is likely to continue developing as more data accumulates. For practical guidance on diabetes risk factors specific to different populations, including those associated with higher diabetes risk in certain ethnic groups, see our guide on diabetes risk factors every adult should know. Understanding both the value and the limitations of the A1C test — including these population-level differences — supports more nuanced and equitable use of this important measurement across diverse patient populations.
Sources: American Diabetes Association. Standards of Medical Care in Diabetes — 2024. Diabetes Care. 2024;47(Suppl 1):S20–S42. • The DCCT Research Group. The Effect of Intensive Treatment of Diabetes on the Development of Long-Term Complications. N Engl J Med. 1993;329(14):977–986. • National Institute of Diabetes and Digestive and Kidney Diseases. The A1C Test and Diabetes. NIDDK; 2023.
This breakdown of a1c test: what it means for is exactly what patients need before a specialist appointment. The specific numbers and thresholds mentioned are exactly what I needed to understand my results. This gave me real confidence going into my next specialist appointment.
This is one of the clearest explanations of a1c test: what it means for I have found. The connection between lifestyle choices and long-term outcomes is explained clearly here. Shared this with three friends who are dealing with related issues. Very useful resource.
Really well-written article on a1c test: what it means for. The article answered questions I didn’t even know I had until I started reading. This is going into my health folder that I bring to every doctor’s visit.