

What Is Normal Blood Sugar? Ranges Explained
Understanding what is normal blood sugar is foundational to knowing whether your own glucose measurements are healthy, concerning, or require action. Blood sugar — more precisely, blood glucose — fluctuates throughout every day in response to eating, fasting, exercise, stress, sleep, and the normal rhythms of insulin and counter-regulatory hormones. What matters clinically is not any single reading but rather whether your glucose values fall within the ranges that medical evidence has identified as consistent with metabolic health, and how often and by how much they stray outside those ranges. This guide explains the established reference ranges for fasting, post-meal, and random blood glucose — as well as the A1C test that captures the longer-term picture — and clarifies what different values mean in terms of health status, risk, and appropriate next steps. For context on how blood sugar is regulated and why it matters, our guides on what blood sugar is and how the body controls blood sugar provide the physiological foundation.
Normal Fasting Blood Sugar
Fasting blood glucose is measured after a period of at least eight hours without eating or drinking anything other than water. It reflects the baseline glucose level that the body maintains when no new glucose is being absorbed from food — a level determined primarily by the liver’s overnight glucose output and the insulin level needed to balance it. The fasting measurement is the most commonly used initial screening test for diabetes and prediabetes because it is reproducible, straightforward to perform, and not dependent on what was eaten recently.
The American Diabetes Association defines the following fasting plasma glucose categories:
- Normal: Below 100 mg/dL (5.6 mmol/L). A fasting glucose consistently below 100 mg/dL indicates normal glucose regulation. The pancreas is producing adequate insulin, the liver’s glucose output overnight is being appropriately balanced, and insulin sensitivity is sufficient for basal metabolic needs.
- Prediabetes (Impaired Fasting Glucose): 100–125 mg/dL (5.6–6.9 mmol/L). Fasting values in this range indicate that fasting glucose regulation is impaired — the insulin response is not fully suppressing hepatic glucose output overnight, or insulin sensitivity is reduced enough that basal glucose clearance is incomplete. This range is called “impaired fasting glucose” and represents prediabetes. For a detailed understanding of what prediabetes means, our guide on what prediabetes is covers the risk, reversibility, and significance of this intermediate state.
- Diabetes: 126 mg/dL (7.0 mmol/L) or above on two separate occasions. A fasting glucose of 126 mg/dL or higher, confirmed on a repeat test on a different day, meets the diagnostic criterion for diabetes mellitus. A single elevated reading in the absence of symptoms requires confirmation before a diagnosis is made.
A key nuance of fasting glucose is that it primarily reflects hepatic glucose production rather than the full picture of insulin sensitivity. Some people — particularly those with early insulin resistance predominantly affecting post-meal glucose clearance — may have a normal fasting glucose while having significantly elevated post-meal values. Fasting glucose alone can therefore underestimate the degree of glucose dysregulation present, which is one reason why the A1C and post-meal measurements provide complementary information. The detailed explanation of what fasting blood sugar means and how to test it accurately is covered in our guide on fasting blood sugar explained.
Normal Post-Meal Blood Sugar
Post-meal (postprandial) blood glucose is measured at a defined time after eating — typically one to two hours after the start of a meal. In clinical testing, the most widely used standardized measure is the two-hour plasma glucose during an oral glucose tolerance test (OGTT), in which a person drinks 75 grams of glucose solution and blood glucose is measured two hours later. In routine home monitoring, post-meal readings taken one to two hours after the start of a meal provide a practical approximation of this same measurement.
The American Diabetes Association defines the following two-hour post-meal glucose categories:
- Normal: Below 140 mg/dL (7.8 mmol/L). After a standard glucose load or mixed meal, a glucose that returns below 140 mg/dL within two hours indicates that the pancreas produced sufficient insulin to clear the post-meal glucose rise efficiently. Peak glucose during the first hour may briefly reach 140–160 mg/dL in healthy individuals before coming back down — the two-hour value captures whether the clearance was complete.
- Prediabetes (Impaired Glucose Tolerance): 140–199 mg/dL (7.8–11.0 mmol/L) at two hours. This range — called “impaired glucose tolerance” — indicates that post-meal glucose clearance is impaired. The pancreas may be producing insufficient insulin in response to the glucose load, or peripheral insulin resistance may be preventing adequate glucose uptake from the blood into cells. This is the most sensitive test for detecting early insulin resistance, because post-meal glucose clearance is often the first aspect of glucose regulation to fail as insulin resistance develops. Our guide on post-meal blood sugar explained covers what happens to glucose after eating in detail.
- Diabetes: 200 mg/dL (11.1 mmol/L) or above at two hours. A two-hour post-glucose load value at or above 200 mg/dL meets the diagnostic criterion for diabetes mellitus.
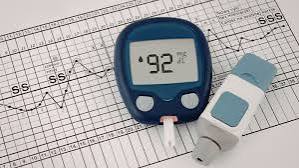
- Fasting (8+ hrs no food): Normal <100 mg/dL | Prediabetes 100–125 | Diabetes ≥126
- 2-hour post-meal: Normal <140 mg/dL | Prediabetes 140–199 | Diabetes ≥200
- A1C: Normal <5.7% | Prediabetes 5.7–6.4% | Diabetes ≥6.5%
- Random (any time): Diabetes threshold ≥200 mg/dL with symptoms
- Pre-meal (diabetes management target): 80–130 mg/dL per ADA guidelines
- Bedtime (diabetes management target): 80–180 mg/dL per ADA guidelines
Normal A1C Range
The A1C (glycated hemoglobin, also written HbA1c) test measures the percentage of hemoglobin molecules in the blood that have glucose attached to them — a percentage that reflects average blood glucose over the preceding two to three months. Because A1C does not require fasting and reflects a longer time window than a single glucose measurement, it is widely used for both diagnosis of diabetes and monitoring of glucose control in people already diagnosed. Our detailed guide on the A1C test explains what it measures, how it relates to average blood glucose, and its limitations.
The American Diabetes Association defines the following A1C categories:
- Normal: Below 5.7%. An A1C below 5.7% indicates that average blood glucose over the past two to three months has been in the healthy range. This corresponds to an estimated average glucose (eAG) below approximately 117 mg/dL.
- Prediabetes: 5.7–6.4%. An A1C in this range indicates elevated average glucose consistent with prediabetes. The risk of progressing to Type 2 diabetes is substantially elevated, particularly at the higher end of this range (6.0–6.4%). At the same time, prediabetes is often reversible through lifestyle modification — weight loss, increased physical activity, and dietary change can return A1C to the normal range in many people. The diabetes risk factors guide helps identify who is at highest risk for progression.
- Diabetes: 6.5% or above. An A1C at or above 6.5%, confirmed on a repeat test, meets the diagnostic criterion for diabetes mellitus. For people already diagnosed with diabetes, the typical treatment target is A1C below 7.0% (though targets are individualized — some people benefit from tighter targets, others from more lenient targets).
One important limitation of A1C is that it reflects an average — it can miss significant glucose variability that produces high and low peaks that cancel out to an apparently normal average. A person with frequent hypoglycemic episodes alternating with hyperglycemic episodes may have an A1C that looks normal while actually experiencing problematic glucose swings. This is one reason why home glucose monitoring — covered in our guide on home blood sugar monitoring — provides information about glucose variability and patterns that A1C cannot capture.
Blood Sugar Targets for People Managing Diabetes
The reference ranges above define normal and abnormal blood sugar for diagnosis. For people already diagnosed with diabetes who are actively managing their condition, slightly different targets apply — specific goals that reflect what glucose control is achievable with medication and lifestyle while balancing the risk of hypoglycemia.
The American Diabetes Association recommends the following blood glucose targets for most non-pregnant adults with diabetes:
- Before meals (preprandial): 80–130 mg/dL
- One to two hours after the start of a meal (postprandial peak): Below 180 mg/dL
- A1C: Below 7.0% for most adults (individualized to below 6.5% for some with low hypoglycemia risk and long life expectancy, or to 8.0% or higher for those with significant hypoglycemia risk, limited life expectancy, or advanced complications)
These management targets differ from the diagnostic thresholds above because they are set to balance glucose control benefits against the risk of hypoglycemia from medication. The diagnostic threshold for normal fasting glucose is below 100 mg/dL, but targeting below 100 mg/dL in someone using insulin would produce too many hypoglycemic episodes — so the management target of 80–130 mg/dL provides a window that supports good control without excessive low glucose risk. Understanding the difference between diagnostic ranges (used to identify whether someone has a blood glucose problem) and management targets (used to guide treatment in someone already diagnosed) prevents confusion when reading glucose results in different contexts. For the full picture of what insulin resistance means in relation to these values, and how it shapes the targets used in clinical practice, see our dedicated guide on that topic.
Factors That Affect Blood Sugar Readings
Several factors beyond underlying metabolic health can affect blood glucose readings, and understanding them prevents misinterpretation of individual values.
Timing relative to meals: Blood glucose rises within 15–30 minutes of eating and peaks within 45–90 minutes in most people. A glucose reading taken at different times relative to a meal will differ substantially from a reading taken at the standardized fasting or two-hour post-meal timepoints. Comparing readings taken at different times can give a misleading picture of control — consistent testing at the same timepoints (always fasting before breakfast, always one to two hours after meals) makes patterns meaningful.
Illness and infection: Physical illness and infection reliably raise blood glucose through the release of stress hormones (cortisol, adrenaline, glucagon) that promote glucose production and reduce insulin sensitivity. A blood glucose reading taken during an illness may be meaningfully higher than the person’s typical level, even in someone without diabetes.
Exercise: Moderate aerobic exercise generally lowers blood glucose by increasing glucose uptake into muscle cells independent of insulin (through GLUT4 translocation). Very intense exercise or prolonged exercise can temporarily raise blood glucose through stress hormone release. The timing and type of exercise therefore affects when a blood glucose reading is taken and what it means.
Stress: Psychological stress releases cortisol and adrenaline, both of which raise blood glucose. A glucose reading taken during a stressful period — before a medical procedure, during a difficult workday, or after a conflict — may be higher than baseline for this person under normal conditions.
Meter accuracy and technique: Home glucose meters have a permitted margin of error of ±15% of the true value by FDA standards, meaning a true glucose of 100 mg/dL may read as anywhere from 85 to 115 mg/dL on a home meter. Proper technique — clean dry finger, fresh lancet, adequate blood drop, correct test strip handling — minimizes error within the meter’s inherent limitations. A single reading from a home meter should be interpreted as an approximation within this range, not a precise value. Our guide on home blood sugar monitoring covers proper testing technique and how to calibrate expectations for home meter readings. When readings seem inconsistent or surprising, understanding these factors — rather than immediately concluding something is wrong or dismissing the result — allows a more nuanced interpretation. A pattern of consistently elevated readings across multiple days and testing contexts is more clinically meaningful than any single reading, and is the kind of data that warrants medical evaluation for early signs of high blood sugar or diabetes.
How Blood Sugar Changes Through the Day
Understanding normal blood sugar means understanding that glucose is not a static value — it follows a dynamic pattern through every 24-hour period that is shaped by eating, fasting, activity, sleep, and circadian hormonal rhythms. Knowing this pattern helps interpret individual readings in context and identify whether a given value is expected or concerning given when it was taken.
In a person with normal glucose regulation, the typical daily glucose pattern looks like this: fasting glucose on waking is in the 70–95 mg/dL range, influenced partly by the dawn phenomenon (a modest rise in blood glucose in the early morning hours, driven by the cortisol and growth hormone surges that accompany waking). After breakfast, glucose rises — typically peaking at 120–140 mg/dL within 45–60 minutes — and returns to below 120 mg/dL by the two-hour mark as insulin efficiently clears the post-meal glucose rise. Through the mid-morning, glucose stabilizes in the 80–100 mg/dL range. After lunch, a similar rise and return to baseline occurs. In the afternoon, glucose may drift slightly lower as the liver’s glucose output is suppressed and muscle activity through the day continues to draw on blood glucose. After dinner, a similar post-meal peak and recovery cycle occurs. Overnight during sleep, glucose gradually falls to its fasting range as the body’s glucose needs are minimal and insulin output is low, with the early-morning cortisol rise nudging glucose slightly upward before waking. For people who eat snacks between meals, smaller post-snack glucose rises occur between the main meal peaks. The glucose variability across this pattern — measured in mmol/L or mg/dL, or in percentage of time spent in different ranges on a continuous glucose monitor — is the “glucose signature” that reflects metabolic health in its full dynamic complexity. A flat, low-variability glucose line — spending most of the day in the 80–120 mg/dL range — represents excellent metabolic health; increasing variability, higher peaks, and slower returns to baseline indicate declining insulin sensitivity or deficiency. For a deeper understanding of normal versus abnormal post-meal glucose patterns, our guide on post-meal blood sugar explained provides detailed context. And for those who want to observe their own glucose pattern through the day — rather than relying on single-point snapshots — continuous glucose monitoring or multiple-point home testing as described in our home blood sugar monitoring guide provides the data to see their personal glucose signature.
Blood Sugar in Children and Adolescents
The blood glucose reference ranges described above (fasting below 100 mg/dL, post-meal below 140 mg/dL, A1C below 5.7%) are the same for children as for adults — the diagnostic thresholds for prediabetes and diabetes in children use identical glucose values. However, several important differences characterize glucose physiology and diabetes in children and adolescents that are worth understanding.
Children and adolescents with Type 1 diabetes — the most common form of diabetes in youth — typically have lower A1C targets than adults, because the developing brain is particularly sensitive to hypoglycemia and because young children cannot reliably recognize and communicate symptoms of low blood sugar. The ADA recommends A1C below 7.0% for children and adolescents with Type 1 diabetes, with individualization based on age, hypoglycemia awareness, and family support.
Type 2 diabetes in children and adolescents has been increasing substantially over the past two decades, driven by obesity and sedentary lifestyles affecting younger age groups. Pediatric Type 2 diabetes tends to be more aggressive than adult-onset Type 2, with faster beta cell decline and earlier development of complications, making early detection and treatment particularly important. A fasting glucose or A1C check is appropriate for children who are overweight or obese, have a family history of Type 2 diabetes, are of high-risk ethnic background (Black, Hispanic, Native American, Asian American, Pacific Islander), show signs of insulin resistance such as acanthosis nigricans, or have other metabolic risk factors. Screening for prediabetes and diabetes in children at risk follows the same diagnostic criteria as adults, using the same glucose thresholds.
For healthy children and adolescents without diabetes, blood glucose generally follows the same pattern as in adults — rising modestly after meals and returning to fasting range within two hours. The higher energy needs and typically greater insulin sensitivity of youth mean that their fasting glucose tends to sit in the lower-normal range (70–90 mg/dL) rather than the upper-normal range, and post-meal peaks are generally lower and shorter than in older adults with somewhat reduced insulin sensitivity. Understanding these patterns is relevant both for parents monitoring a child’s glucose and for clinicians interpreting pediatric blood glucose results. Just as in adults, a single elevated value during an illness or stressful period in a child does not warrant a diabetes diagnosis — confirmation on repeat testing or with A1C is required.
When Normal Blood Sugar Becomes Concerning
Knowing what is normal blood sugar provides the reference point for recognizing when values are trending in the wrong direction — even before they reach the diagnostic thresholds for prediabetes or diabetes. A fasting glucose that was 82 mg/dL three years ago and is now 95 mg/dL represents a meaningful upward trend even though both values are technically “normal.” An A1C that has moved from 5.2% to 5.5% over two years signals worsening glucose regulation even though both values are below the prediabetes threshold. Tracking these trends over time — which requires actually getting tested regularly rather than assuming everything is fine — allows early detection of metabolic drift that can be reversed before it reaches the clinical diagnosis threshold.
Adults without known diabetes or risk factors should have fasting glucose or A1C checked at least every three years starting at age 35, per the U.S. Preventive Services Task Force recommendations for overweight or obese adults. Those with risk factors — family history of diabetes, prior gestational diabetes, history of prediabetes, overweight or obesity, physical inactivity, certain ethnic backgrounds, or cardiovascular disease — should be screened more frequently, typically annually. Understanding diabetes risk factors helps identify who should prioritize more frequent testing. And for anyone already in the prediabetes range, annual A1C and fasting glucose checks are appropriate to catch progression to diabetes early, when treatment intervention has the greatest impact. The resource most people find useful for relating their own specific numbers to the ranges in this guide is a comprehensive blood sugar chart — which we cover in detail, with ranges for all ages and testing contexts, in our guide on the blood sugar chart for adults.
Sources: American Diabetes Association. Standards of Medical Care in Diabetes — 2024. Diabetes Care. 2024;47(Suppl 1):S20–S42. • American Diabetes Association. Diagnosis and Classification of Diabetes: Standards of Care in Diabetes — 2024. Diabetes Care. 2024;47(Suppl 1):S20–S42. • National Institute of Diabetes and Digestive and Kidney Diseases. Diabetes Tests and Diagnosis. NIDDK; 2023.
I never fully understood what is normal blood sugar? ranges until I read this. The specific numbers and thresholds mentioned are exactly what I needed to understand my results. This gave me real confidence going into my next specialist appointment.
I shared this article on what is normal blood sugar? ranges with my doctor and they appreciated the level of detail. The article answered questions I didn’t even know I had until I started reading. Exactly the kind of evidence-based information that is hard to find in one place.
I have been reading about what is normal blood sugar? ranges for weeks and this is the most thorough guide I found. I have tried following advice from several sources but this is most consistent with what my specialist told me. Looking forward to reading more articles from this website.