
Holter Monitor: Tracking Heart Rhythm Over 24 Hours
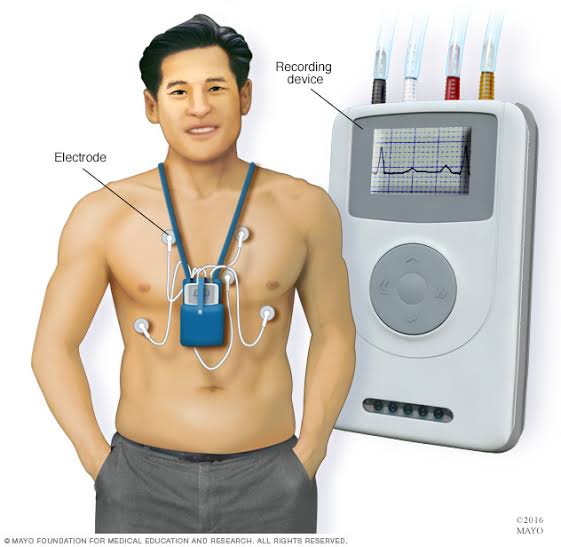
The Holter monitor is a wearable electrocardiogram (ECG) device that records the heart’s electrical activity continuously over 24 to 48 hours ??? or up to 14 days with modern adhesive patch monitors ??? during a patient’s normal daily activities. Named after American biophysicist Norman Holter, who developed the first portable cardiac monitor in the 1950s, the Holter monitor transformed cardiac arrhythmia diagnosis by extending ECG recording beyond the 10-second snapshot of a standard 12-lead ECG to capture the full spectrum of heart rhythm variability throughout an entire day and night.
The fundamental limitation of the standard resting ECG for arrhythmia diagnosis is its brevity: most cardiac arrhythmias are intermittent ??? they occur unpredictably, last seconds to minutes, and are absent during a routine clinic visit. A patient with paroxysmal atrial fibrillation that occurs three times per week for 20-minute episodes has roughly a 97 percent probability of having a perfectly normal ECG at any given moment during a clinic visit. The Holter monitor solves this problem by capturing the entire cardiac rhythm over an extended period, dramatically increasing the probability of recording the arrhythmia when it occurs.
When a Holter Monitor Is Ordered ??? Clinical Indications
Cardiologists order Holter monitoring in specific clinical situations where continuous rhythm recording provides information that the standard ECG cannot:
Palpitations evaluation: Palpitations ??? the sensation of a rapid, irregular, or pounding heartbeat ??? are among the most common cardiac complaints, affecting up to 16 percent of adults at some point. Most palpitations are benign (caused by premature atrial or ventricular contractions, anxiety, caffeine, or sinus tachycardia from dehydration or physical activity), but some represent serious arrhythmias (atrial fibrillation, supraventricular tachycardia, ventricular tachycardia) that require treatment. The Holter monitor identifies which category a patient’s palpitations fall into by recording the heart rhythm during the specific moment of symptom onset ??? the critical symptom-rhythm correlation that changes management.
Syncope and presyncope evaluation: Unexplained syncope (brief loss of consciousness) or near-syncope (lightheadedness with near-loss of consciousness) may result from cardiac arrhythmia ??? dangerously fast rhythms (ventricular tachycardia causing cardiac output failure) or dangerously slow rhythms (complete heart block or prolonged sinus arrest causing insufficient cardiac output). Identifying arrhythmia as the cause of syncope is diagnostically urgent because many arrhythmic causes of syncope (ventricular tachycardia in structural heart disease, complete heart block) carry life-threatening implications requiring immediate treatment. The Holter monitor is the first-line rhythm monitoring study for syncope evaluation in most patients, though its 24 to 48 hour duration is often insufficient for infrequent syncope episodes ??? longer monitoring (extended patch, implantable loop recorder) is used when the Holter is negative but suspicion of arrhythmic syncope persists.
Atrial fibrillation screening after cryptogenic stroke: Approximately 25 percent of ischemic strokes have no identified cause after standard workup (cryptogenic stroke). A significant proportion of these are caused by paroxysmal atrial fibrillation producing left atrial appendage thrombus embolization ??? AF that was not present on the admission ECG or standard 24-hour monitoring. Guidelines recommend prolonged cardiac monitoring (minimum 30 days of monitoring in most guidelines) after cryptogenic stroke to detect paroxysmal AF, since detection changes management from antiplatelet therapy (used for non-cardioembolic stroke) to anticoagulation (essential for AF-related stroke prevention).
Arrhythmia treatment monitoring: After initiation of antiarrhythmic medications or catheter ablation procedures, follow-up Holter monitoring assesses treatment efficacy ??? documenting reduction in AF burden, PVC burden, or SVT episodes compared to pre-treatment baseline. Holter monitoring is also used for safety monitoring after starting antiarrhythmic drugs that can prolong the QT interval (amiodarone, sotalol, flecainide) ??? detecting drug-induced QT prolongation that predisposes to life-threatening torsades de pointes ventricular arrhythmia.
What to Expect During Your Holter Monitor Recording
For patients who have been prescribed a Holter monitor, understanding what to expect during the recording period helps ensure that the data captured is maximally useful for diagnosis:
Setup appointment: A cardiac technician applies 3 to 5 electrode patches (adhesive ECG stickers) to your chest ??? the specific placement varies by lead configuration, but typically includes electrodes near the right and left clavicles, lower left chest, and right side of the chest. For traditional wire-based monitors, wires connect these electrodes to the recording device, which clips to a belt or is carried in a shoulder pouch. For patch-based monitors (Zio Patch and similar), a single self-adhesive unit combines electrodes and recorder in one device that adheres directly to the left chest below the collarbone ??? no external wires or separate device.
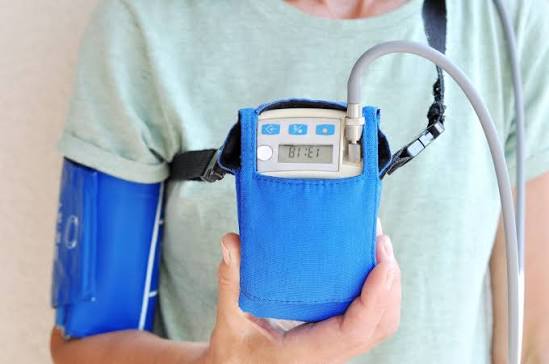
During the recording period: Carry out your normal daily activities as fully as possible ??? the diagnostic value of the Holter monitor depends on capturing your heart’s behavior during the activities that provoke your symptoms. Exercise, sleep, work, emotional stress ??? all these states are relevant to rhythm monitoring. You should: maintain the symptom diary diligently (record every symptom with the time it started and stopped, and describe what you were doing and feeling ??? this is the most important contributor to the final diagnosis); avoid prolonged submersion in water (bathing and swimming are typically restricted for wire-based Holter monitors; patch monitors are water-resistant for showering but not swimming); avoid strong electromagnetic fields (MRI scanners ??? do not have an MRI while wearing the monitor; airport scanners are generally acceptable).
After the recording: Return the device to your cardiology department or mail it per the instructions provided. Analysis takes 24 to 72 hours for standard Holter monitors, 1 to 2 weeks for extended patch recordings. Results are typically reviewed by a cardiac electrophysiology specialist who correlates the computer-analyzed rhythm data with your symptom diary ??? the report is sent to your ordering physician, who will contact you to discuss findings and next steps.
Understanding Your Holter Results ??? Common Findings Explained
When you receive your Holter monitor results, here are the most common findings and what they mean for your management:
“No significant arrhythmia detected” with no symptoms: The monitor recorded a normal or near-normal rhythm throughout the recording period and you had no symptoms during this time. This is a reassuring but incomplete finding ??? it does not rule out an arrhythmia that occurs less frequently than daily. If your symptoms persist, extended monitoring (2-week patch or 30-day event monitor) may be warranted to increase the diagnostic yield.
“Symptoms occurred without arrhythmia”: The key finding that redirects diagnosis ??? you experienced your typical symptoms (palpitations, lightheadedness) during the recording period, and at those specific moments, the ECG showed normal sinus rhythm without arrhythmia. This effectively rules out cardiac arrhythmia as the cause of those symptoms and redirects the evaluation toward non-cardiac causes: anxiety and panic disorder (very common cause of palpitations without arrhythmia), anemia, hyperthyroidism, gastroesophageal reflux (can produce chest discomfort and palpitation-like sensations), or orthostatic hypotension.
“Paroxysmal atrial fibrillation detected”: The monitor captured episodes of AF ??? an irregular rhythm without visible P waves ??? during the recording period. The duration of the recorded AF episodes, the total AF burden (what percentage of the 24-hour recording was in AF), the rate during AF, and the symptom correlation are all clinically important. This finding typically leads to: anticoagulation initiation (for stroke prevention ??? based on CHA???DS???-VASc score), rate control evaluation (heart rate during AF ??? if too fast, rate-controlling medications are adjusted), and consideration of rhythm control strategy (antiarrhythmic medications or catheter ablation to restore and maintain sinus rhythm).
“High PVC burden” (>10% of beats): A PVC burden exceeding 10 percent (approximately 10,000 to 15,000 PVCs per 24 hours) is associated with tachycardia-induced cardiomyopathy ??? a reversible form of LV dysfunction caused by chronic abnormal electrical activation patterns from frequent PVCs. Patients with high PVC burden and echocardiographic LV dysfunction should be referred for evaluation of PVC ablation or antiarrhythmic therapy, both of which can reverse the cardiomyopathy with successful PVC suppression.
See our related articles on common heart tests explained, what is an electrocardiogram, atrial fibrillation symptoms and risks, cardiac MRI when it may be used, and stress test for heart health. The American Heart Association Holter monitor guide, NHLBI Holter monitor overview, and Heart Rhythm Society clinical guidelines provide authoritative clinical standards for ambulatory ECG monitoring.
- Sanna T, et al. Cryptogenic Stroke and Underlying Atrial Fibrillation (CRYSTAL AF). N Engl J Med. 2014;370(26):2478-2486.
- Crawford MH, et al. ACC/AHA Guidelines for Ambulatory Electrocardiography. J Am Coll Cardiol. 1999;34(3):912-948.
- Zimetbaum PJ, Josephson ME. The Evolving Role of Ambulatory Arrhythmia Monitoring in General Clinical Practice. Ann Intern Med. 1999;130(10):848-856.
- Latchamsetty R, Bogun F. Premature Ventricular Complexes and Premature Ventricular Complex Induced Cardiomyopathy. Curr Probl Cardiol. 2015;40(9):379-422.
- Brignole M, et al. 2018 ESC Guidelines for the diagnosis and management of syncope. Eur Heart J. 2018;39(21):1883-1948.
Heart Rate Variability ??? The Hidden Insight in Holter Data
Beyond rhythm and arrhythmia detection, Holter monitor data contains a rich source of prognostic information that is less well-known to patients: heart rate variability (HRV) ??? the variation in the time interval between consecutive heartbeats. HRV is a measure of the autonomic nervous system’s influence on the heart, reflecting the dynamic interplay between sympathetic (stress-activating) and parasympathetic (rest-and-recovery) nervous system signals that modulate the heart’s pacemaker cells moment by moment.
In a healthy person with good autonomic function, the interval between heartbeats varies continuously ??? accelerating slightly during inhalation (when sympathetic tone increases) and slowing during exhalation (when parasympathetic tone increases). This normal variability is called respiratory sinus arrhythmia and reflects responsive, healthy autonomic control. Low HRV ??? reduced beat-to-beat variability ??? indicates dominance of sympathetic nervous system tone with diminished parasympathetic modulation. It is associated with poorer cardiovascular outcomes across multiple patient populations:
In post-myocardial infarction patients, reduced HRV (specifically the time-domain metric SDNN ??? standard deviation of normal RR intervals ??? below 50 milliseconds) is an independent predictor of all-cause mortality and sudden cardiac death at 2-year follow-up ??? one of the landmark findings of the ATRAMI study (Autonomic Tone and Reflexes After Myocardial Infarction). In heart failure patients, low HRV predicts hospitalization and death independently of LVEF and BNP. In general population studies, low HRV is associated with increased incidence of coronary heart disease, heart failure, and all-cause mortality ??? suggesting that HRV captures an aspect of cardiovascular risk not measured by traditional risk factors.
The clinical utility of HRV from Holter monitoring: Holter-derived HRV metrics are reported in the standard Holter analysis and are used by electrophysiologists to assess autonomic dysfunction ??? particularly in post-MI patients, heart failure patients, and patients with diabetic autonomic neuropathy (which is associated with severely reduced HRV and increased risk of arrhythmic sudden death). HRV is also increasingly used in cardiac rehabilitation programs as a real-time measure of recovery and training readiness, though this application is more common with wearable consumer devices than clinical Holter monitors.
Specific Arrhythmias That Holter Monitoring Diagnoses ??? A Closer Look
Understanding the specific arrhythmias that Holter monitoring is designed to detect helps patients understand why their physician chose this test and what the results mean:
Paroxysmal atrial fibrillation (PAF): Atrial fibrillation is the most clinically significant arrhythmia detected on Holter monitoring ??? affecting 2 to 3 percent of the general population and causing approximately one in three ischemic strokes through left atrial appendage thrombus formation and embolization. “Paroxysmal” AF is episodic ??? it starts and terminates spontaneously, lasting seconds to days, before the patient returns to normal sinus rhythm. Between episodes, the ECG is completely normal ??? making standard ECG almost useless for diagnosis. Holter monitoring is the primary diagnostic tool for paroxysmal AF in patients with palpitations, unexplained dyspnea, or following cryptogenic stroke. The minimum duration of AF detected on Holter that is clinically significant ??? and warrants anticoagulation consideration ??? is a matter of ongoing investigation: episodes lasting more than 30 seconds (some guidelines) or more than 6 minutes (device-detected AF threshold in some implantable device studies) are used as thresholds, though the stroke risk associated with very brief AF episodes (<24 hours of total burden) appears lower than sustained AF.
Wolff-Parkinson-White (WPW) syndrome: A congenital accessory pathway (bundle of Kent) connecting the atria and ventricles in parallel with the normal AV node creates pre-excitation ??? electrical impulses bypass the rate-limiting AV node and activate the ventricles early, producing the characteristic delta wave (slurred upstroke of the QRS complex) on resting ECG. WPW can cause paroxysmal re-entrant tachycardia (AVRT ??? atrioventricular re-entrant tachycardia) and, critically, can conduct atrial fibrillation at dangerously rapid ventricular rates through the accessory pathway ??? potentially triggering ventricular fibrillation and sudden cardiac death. Holter monitoring identifies the rate at the onset of tachycardia, the duration of episodes, the pre-excitation pattern, and can capture the transition from sinus rhythm to AVRT ??? information used by electrophysiologists to determine whether catheter ablation of the accessory pathway is indicated.
Long QT syndrome: The QT interval on the ECG represents the total duration of ventricular depolarization and repolarization. Prolongation of the QT interval ??? whether congenital (long QT syndrome types 1 through 16, caused by mutations in cardiac ion channel genes) or acquired (from medications, electrolyte abnormalities, or structural heart disease) ??? predisposes to torsades de pointes ventricular tachycardia, which can degenerate into ventricular fibrillation and sudden cardiac death. Holter monitoring measures the QT interval over 24 hours across different heart rates and can detect QT prolongation that is not apparent on a resting ECG ??? particularly important for monitoring patients on QT-prolonging medications (sotalol, amiodarone, certain antibiotics and antifungals, methadone, psychiatric medications). The QTc (QT interval corrected for heart rate) above 500 milliseconds is associated with significantly increased torsades de pointes risk.
Interpreting the Holter Monitor Report ??? A Section-by-Section Guide
When you receive the report from your Holter monitor, the document can seem overwhelming ??? pages of statistics, rhythm strips, and medical terminology. Here is a practical guide to reading the key sections:
Heart rate summary: The report will list your minimum heart rate (typically during sleep, normally 40 to 60 beats per minute in fit adults; below 40 bpm may indicate sinus bradycardia or heart block requiring evaluation), maximum heart rate (during peak exertion or emotional stress; above 200 bpm during exercise is normal in young adults but may indicate SVT if occurring abruptly at rest), and 24-hour average heart rate. An average heart rate above 80 bpm at rest may indicate insufficient beta-blocker dosing in patients with heart failure or coronary artery disease ??? where target resting heart rate is typically below 70 to 75 bpm.
Pause events: The report identifies any sinus pauses ??? periods where the heart does not beat. Pauses less than 2 seconds are common during sleep and are generally benign. Pauses 2 to 2.5 seconds during sleep may be normal in conditioned athletes with high vagal tone. Pauses exceeding 3 seconds during wakefulness, or any pause associated with symptoms (lightheadedness, syncope), are clinically significant and may indicate sick sinus syndrome requiring pacemaker evaluation.
Ectopic beat summary: Premature atrial contractions (PACs) are extremely common ??? present to some degree in virtually all adults. Up to 100 to 200 PACs per 24 hours is generally considered normal and requires no treatment in asymptomatic patients without structural heart disease. More than 500 PACs per 24 hours or runs of three or more consecutive PACs (atrial tachycardia or atrial flutter) warrant further evaluation, particularly if symptomatic. Premature ventricular contractions (PVCs) similarly occur in most adults in small numbers; isolated PVCs in structurally normal hearts are generally benign. High PVC burden (>10% of all beats, or approximately 10,000 to 15,000 per day) is associated with PVC-induced cardiomyopathy if sustained ??? prompt referral to an electrophysiologist for consideration of ablation is appropriate.
The Symptom Diary ??? Why It Is as Important as the Monitor Itself
The Holter monitor records electrical data ??? your symptom diary provides the clinical context that transforms that data into a meaningful diagnosis. The diary is not optional paperwork; it is the essential link that tells your cardiologist what you were experiencing at the precise moments that matter most:
The most diagnostically useful Holter monitor results are those with perfect symptom-time correlation. When you feel palpitations, chest tightness, lightheadedness, or any other symptom during the recording period, record the exact time (check your watch or phone), describe the symptom specifically (“heart racing suddenly, like a switch flip, lasting 2 minutes then stopping abruptly”), note what you were doing (resting, walking, sleeping, emotional stress), and record any associated symptoms (chest pain, shortness of breath, near-fainting). The more specific your diary entries, the more useful the correlation is for your cardiologist.
If you have an event but forget to record it in the diary, or if the time is imprecisely noted, the cardiologist cannot easily locate the relevant ECG strip ??? reducing the diagnostic value of the monitor. If you have no symptoms during the recording period, that is also valuable information: it tells your provider that extending the monitoring duration may be necessary to capture your intermittent symptoms. A complete, time-stamped diary is a better diagnostic contribution than a perfect ECG recording without symptom data.
When the Holter Monitor Is Negative ??? What Comes Next
A negative Holter monitor ??? meaning no significant arrhythmia was detected and no symptoms occurred during the recording period ??? does not necessarily mean a patient’s symptoms have no cardiac cause. It means that the symptoms did not occur during the specific 24 to 48 hours of recording. For patients with frequent daily symptoms, this is reassuring and largely rules out arrhythmia. For patients with weekly or monthly symptoms, the diagnostic yield of a standard Holter monitor is low ??? typically 10 to 20 percent for detecting the causative arrhythmia in patients with infrequent palpitations or syncope.
When the Holter monitor is negative but symptoms persist or clinical suspicion of arrhythmia remains, the next diagnostic step depends on symptom frequency: for symptoms occurring several times per week, a 14-day extended patch monitor substantially increases diagnostic yield. For less frequent symptoms (monthly or less), a 30-day external event monitor (which the patient activates when symptoms occur, transmitting the rhythm strip remotely for immediate review) is appropriate. For very infrequent syncope (once or twice per year) or high-suspicion unexplained syncope in a patient with structural heart disease, an implantable loop recorder ??? a small subcutaneous device inserted under local anesthesia that continuously records rhythm for up to 3 years ??? provides the highest diagnostic yield of any ambulatory monitoring modality and is cost-effective for the evaluation of unexplained syncope.