
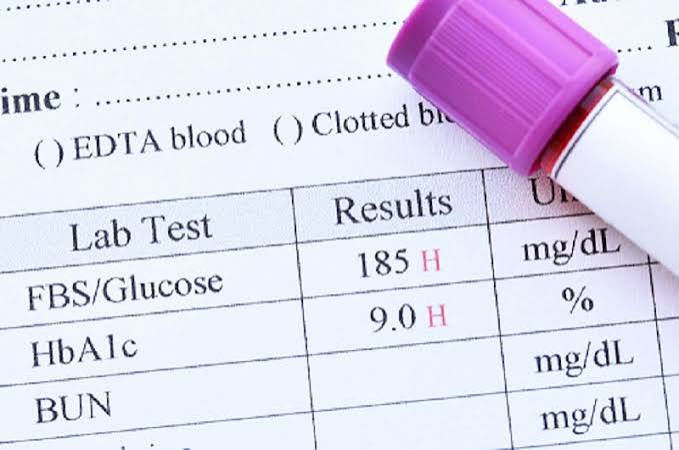
The A1C testing schedule for adults with Type 2 diabetes is one of the most important but least explained aspects of routine diabetes care. Most adults with diabetes know that A1C (also called HbA1c, or glycated hemoglobin) is tested regularly and that the target is “below 7%,” but far fewer understand why the test is done at the specific intervals it is, how to interpret their result in practical terms, what the result means for their treatment plan, and under what circumstances their testing frequency should be increased or decreased. The A1C testing schedule is not arbitrary — it is calibrated to the 2–3 month lifespan of red blood cells (the biological basis of what the test measures), to the time required for medication or lifestyle changes to produce measurable changes in the result, and to the clinical urgency of detecting blood glucose deterioration before complications progress. Understanding all of this — not just the target number but the full clinical rationale for the testing schedule — transforms A1C monitoring from a passive measurement into an active management tool.
The A1C test measures the percentage of hemoglobin (the oxygen-carrying protein in red blood cells) that has had glucose molecules permanently attached to it through a process called glycation. Because red blood cells live approximately 2–3 months before being replaced, the proportion of glycated hemoglobin reflects the average blood glucose level over that 2–3 month period. An A1C of 7.0% corresponds to an estimated average blood glucose of approximately 154 mg/dL. An A1C of 8.0% corresponds to an estimated average of approximately 183 mg/dL. Each 1 percentage point change in A1C corresponds to approximately 29 mg/dL change in average blood glucose. This relationship — between the A1C percentage and the average daily blood glucose it represents — is the foundation for interpreting what A1C results mean and how much improvement a medication or lifestyle change has produced.
How Often Should You Have an A1C Test
The recommended A1C testing schedule depends on the individual patient’s blood glucose control status and how recently any management changes were made:
- Every 3 months (quarterly) — for patients not at target or recently changed treatment: Adults whose A1C is above their target, who have recently had a medication added or changed, who have been newly diagnosed with diabetes, or who are managing diabetes during pregnancy should have A1C tested every 3 months. The 3-month interval is chosen because it takes approximately 8–12 weeks for a medication change or significant lifestyle intervention to fully manifest in the A1C result — testing sooner provides incomplete information about the effect of the change. Quarterly testing during active management adjustment creates a feedback loop that allows timely assessment of whether the change is working and whether further adjustment is needed before another 3 months pass. For newly diagnosed adults, quarterly testing in the first year establishes the baseline trajectory, identifies how much the initial treatment regimen is achieving, and enables rapid escalation if the first medication is insufficient.
- Every 6 months — for stable patients at target: Adults who have achieved and maintained their A1C target for at least two consecutive quarterly measurements, on a stable medication regimen with consistent lifestyle practices, may extend to 6-month A1C testing intervals. The ADA acknowledges that for stable, well-controlled patients, semi-annual testing provides adequate monitoring without the cost and inconvenience of quarterly testing. However, this extension should be a joint decision with the prescribing clinician based on explicit confirmation that the patient is truly stable — not a default assumption. Any significant change in health status, medications (including new medications prescribed by other providers), weight, or lifestyle should prompt return to quarterly testing.
- More frequently than every 3 months — for specific situations: Adults with Type 1 diabetes (or LADA — latent autoimmune diabetes in adults) with highly variable blood glucose may benefit from A1C testing more frequently than quarterly. Continuous glucose monitoring (CGM) users who generate glycemic variability data can also supplement A1C with time-in-range metrics that provide more granular information than A1C alone.

A1C Targets: What Number Should You Aim For
The A1C target recommended by the American Diabetes Association (ADA) is below 7.0% for most non-pregnant adults with diabetes — a threshold chosen because clinical trial data (UKPDS, DCCT/EDIC, ACCORD, ADVANCE) show that HbA1c below 7.0% substantially reduces microvascular complications (retinopathy, nephropathy, neuropathy) with acceptable hypoglycemia risk. However, A1C targets are explicitly individualized in current guidelines, and the single number “below 7.0%” is not appropriate for every patient:
- More stringent targets (below 6.5%) — for selected patients: Adults with short diabetes duration, long life expectancy, no significant cardiovascular disease, no history of severe hypoglycemia, and well-controlled diabetes without side effects from intensive treatment may be appropriate candidates for a tighter A1C target of below 6.5%. These patients are most likely to live long enough for the prevention of microvascular complications to provide substantial lifetime benefit, and least likely to experience the harms (hypoglycemia, treatment burden) that limit the net benefit of tight control in older or sicker patients. This target requires discussion with and endorsement by the prescribing clinician — it is not something to pursue unilaterally, particularly with insulin or sulfonylurea therapy where tighter targets increase hypoglycemia risk.
- Standard target (below 7.0%) — for most adults: The below-7.0% target applies to most adults with Type 2 diabetes of typical duration, without significant comorbidities that increase hypoglycemia risk or limit life expectancy. At this target, the ADA estimates that most adults on standard treatment regimens can achieve the goal without unacceptable hypoglycemia risk, excessive medication burden, or lifestyle restriction.
- Less stringent targets (below 8.0%) — for specific high-risk groups: Adults with a history of severe hypoglycemia, limited life expectancy, extensive microvascular or macrovascular complications, multiple serious comorbidities, or long diabetes duration with difficulty achieving lower targets despite adequate therapy may have an individualized target of below 8.0%. For these patients, the risks of hypoglycemia associated with pursuing tighter control outweigh the long-term benefits of microvascular complication prevention — particularly if complications are already established and largely irreversible. Older adults in particular are often given higher A1C targets because hypoglycemia in this population causes falls, fractures, cardiovascular events, and cognitive decline that are immediately harmful, while the microvascular complications prevented by tight control take 10–15 years to manifest clinically. The full diabetes monitoring context that places A1C within the complete annual monitoring framework is in our annual diabetes care checklist. The checkup schedule that determines when A1C is tested alongside other routine monitoring is in our diabetes checkups: what to expect guide. The medication overview that explains which treatments lower A1C and how much to expect from each drug class is in our diabetes medications overview. The ADA’s A1C resources, the NIDDK’s A1C test information, and the CDC’s A1C guidance provide the authoritative clinical framework for A1C testing and target recommendations in diabetes management.
Factors That Can Make A1C Results Inaccurate
The A1C test is highly reliable in most clinical situations, but several conditions can cause the result to be falsely high or falsely low relative to what home blood glucose monitoring would suggest. Knowing when A1C may be misleading helps ensure that management decisions are based on accurate information:
- Conditions that falsely LOWER A1C (result looks better than actual glucose control): Any condition that shortens the lifespan of red blood cells reduces the proportion of red blood cells that have had time to become glycated, producing a lower A1C than the actual average blood glucose would predict. These include: hemolytic anemia (where red blood cells are destroyed prematurely — from sickle cell disease, G6PD deficiency, autoimmune hemolytic anemia, or other causes); blood transfusions (which introduce new red blood cells that have not been exposed to the patient’s elevated glucose); iron deficiency anemia treatment with erythropoietin (which accelerates red blood cell production and turnover); chronic blood loss (which similarly increases red blood cell turnover); and late-stage pregnancy (which causes expanded plasma volume and relative hemodilution that affects red blood cell concentration). In these situations, the A1C may appear lower than the person’s true average glucose, leading to undertreatment. Alternative glycemic monitoring (fructosamine, glycated albumin, or continuous glucose monitoring) may be more appropriate.
- Conditions that falsely RAISE A1C (result looks worse than actual glucose control): Conditions that extend red blood cell lifespan — fewer red blood cells being replaced, meaning more time for each cell to accumulate glucose attachment — can cause A1C to be higher than the actual average glucose. These include: iron deficiency anemia without treatment (lower red blood cell turnover), vitamin B12 or folate deficiency, splenectomy (removal of the spleen, which reduces red blood cell destruction), and hypothyroidism (which reduces red blood cell turnover). Certain hemoglobin variants (HbS in sickle cell trait, HbC, HbD, HbE) can interfere with some A1C assay methods depending on the laboratory assay used, producing falsely elevated or falsely low results depending on the variant and method combination.
- Ethnic variation in the A1C-to-blood-glucose relationship: Research has identified that African-American adults on average have A1C levels approximately 0.2–0.4 percentage points higher than white adults with the same average blood glucose — a difference attributed to a higher proportion of HbA1c-glycated hemoglobin in red blood cells with longer lifespans. This difference is clinically relevant because it means that an African-American adult with an A1C of 7.0% may actually have a somewhat lower average blood glucose than a white adult with the same result — and conversely, an A1C target of 7.0% may represent slightly tighter glucose control in African-American patients than is recognized. The clinical significance of this finding for individual target-setting remains an active area of discussion in the diabetes community.
- When to use supplemental glycemic monitoring: When A1C reliability is questioned due to any of the above conditions, continuous glucose monitoring (CGM) provides the most comprehensive alternative — directly measuring blood glucose throughout the day and generating time-in-range data that is independent of red blood cell biology. The time in range (TIR) metric — the percentage of time blood glucose is between 70 and 180 mg/dL — is increasingly accepted as a clinically meaningful glycemic metric that complements or supplements A1C in situations where A1C is unreliable. The ADA now recommends a TIR above 70% as a general glycemic goal for most adults with diabetes using CGM.
How to Use Your A1C Result: Connecting the Number to Action
Understanding the A1C testing schedule and interpreting results correctly is most useful when it translates into specific management actions. Here is how different A1C results should connect to clinical responses:
- A1C at or below target — confirm stability and continue: When A1C is at or below the individual target and has been stable for 2 or more consecutive readings, the current management regimen is working. The appropriate action is to continue the current medication and lifestyle approach, extend the testing interval to 6 months if stable, and use the appointment to review other annual monitoring components (eye exam, foot exam, kidney tests) that may be due. Do not push A1C lower than the individual target through medication escalation — reducing A1C below the clinically appropriate target for a given patient increases hypoglycemia risk without proportionate complication prevention benefit.
- A1C 0.5–1.0 percentage points above target — assess the cause and address it: When A1C is modestly above target, the first step is identifying the cause before changing medication. Common causes of A1C drift above target include: dietary changes (increased caloric intake, more refined carbohydrates), reduced physical activity, medication non-adherence (missed doses), addition of a new medication that raises blood glucose (steroids, antipsychotics), weight gain, illness, or progression of the underlying beta cell dysfunction. Addressing the modifiable cause — improving adherence, restoring dietary habits, adjusting for the glucose-raising medication — may restore control without requiring additional diabetes medication. If the cause is genuine disease progression despite adherence, adding or intensifying medication is appropriate.
- A1C more than 1.0 percentage points above target — prompt medication review: A significant gap between the current A1C and the target — particularly if it represents a rise from a previously controlled value — requires a structured medication review at the appointment rather than a “watch and wait” approach. This typically involves reviewing the entire regimen: whether the current medications are at maximum effective doses, whether additional agents should be added, whether medication adherence is the issue, and whether any clinical factors (new illness, new medication interactions, significant weight change) explain the deterioration. The medication overview that covers all diabetes treatment options is in our diabetes medications overview. The complete diabetes monitoring framework that includes the A1C within the full annual checkup system is in our diabetes checkups: what to expect guide and our annual diabetes care checklist. Blood glucose control as reflected by A1C directly affects the kidney monitoring results tracked in our kidney tests for diabetes monitoring guide and the eye exam outcomes covered in our eye exams for people with diabetes article. The ADA’s A1C resources, the NIDDK’s A1C test information, and the CDC’s A1C guidance provide authoritative clinical information on A1C interpretation and use in diabetes management.
A1C Testing Versus Daily Blood Glucose Monitoring: How They Work Together
One of the most common points of confusion for adults with diabetes is understanding the relationship between the A1C testing schedule and daily blood glucose monitoring — either via home blood glucose meters (fingerstick testing) or continuous glucose monitoring (CGM). These are not alternatives; they measure different things and provide complementary information that together give a complete picture of glycemic control:
- What A1C shows and what it misses: A1C provides a reliable summary of average blood glucose over the preceding 8–12 weeks — it is reproducible, standardized, and strongly correlated with long-term complication risk across large clinical trials. However, A1C is a single number that collapses the full distribution of blood glucose values across thousands of individual readings into one average. A person who runs blood glucose of 50 mg/dL for half the day and 220 mg/dL for the other half would have an A1C in the target range — but would be experiencing dangerous hypoglycemia and significant hyperglycemia that A1C alone cannot detect. A1C also cannot reveal the timing of blood glucose excursions (whether high glucose is primarily postprandial or fasting), cannot detect nocturnal hypoglycemia, and cannot provide real-time feedback that guides daily decisions about food, activity, or insulin timing.
- What daily blood glucose monitoring adds: Home blood glucose monitoring and CGM provide the moment-to-moment blood glucose information that A1C cannot supply — showing whether blood glucose is high after specific meals, whether blood glucose drops dangerously overnight, and how physical activity, stress, and medications affect blood glucose in real time. This information guides daily self-management decisions: what to eat, when to exercise, whether to adjust insulin dose, and when to seek medical attention. For adults on insulin therapy, daily blood glucose monitoring is essential for safe dose adjustment — A1C alone cannot guide this. For adults on non-insulin therapy, daily testing provides accountability and feedback that reinforce dietary and lifestyle adherence.
- Time in range as the bridge between A1C and daily monitoring: The time in range (TIR) metric — the percentage of time CGM records blood glucose between 70 and 180 mg/dL — is increasingly validated as a glycemic target in its own right that complements A1C in ways that are clinically meaningful. A TIR above 70% is broadly associated with the same complication-prevention benefit as A1C below 7.0% and has the additional advantage of directly quantifying hypoglycemia exposure (time below 70 mg/dL) and hyperglycemia burden (time above 180 mg/dL) in a way that A1C cannot. Adults who use CGM should ask their clinician about their time in range at every visit alongside their A1C — together these two metrics give the most complete available picture of glycemic control, hypoglycemia risk, and complication risk.
- Integrating both into the quarterly diabetes visit: At each quarterly diabetes visit, the clinician should review both the A1C result and, where available, blood glucose meter logs or CGM reports. The A1C tells whether the overall glucose average is on target over the past 3 months. The meter or CGM data tells what specific patterns explain the A1C result and guides specific management adjustments. Together, these two sources of information — the quarterly A1C test and the ongoing daily blood glucose data — form the backbone of structured diabetes self-management and are the primary tools for detecting problems early enough to intervene before complications develop. The full monitoring schedule that places A1C within the complete annual checkup framework is in our annual diabetes care checklist. The diabetes checkups guide that explains what happens at each clinical visit is our diabetes checkups: what to expect article. Adults who want to understand more about the medications that lower A1C and how they work should read our diabetes medications overview.
The most important thing adults with diabetes can do about their A1C testing schedule is treat each result not as a grade or judgment, but as clinical information — a data point that tells whether the current treatment approach is achieving its goal. An A1C above target is not a failure; it is a signal that something needs to change — and the earlier that signal is detected through regular testing, the more time there is to make the change, assess whether it worked, and adjust again before complications have an opportunity to progress. The system of quarterly or semi-annual A1C testing is designed precisely to create that early detection opportunity. Adults who keep their A1C monitoring current — who understand their target, know when their next test is due, and review results with their clinician with a focus on action rather than judgment — are using the most powerful tool available for long-term diabetes complication prevention. Scheduling the next A1C test before leaving the current appointment is a small habit that consistently prevents the gaps in monitoring that allow blood glucose problems to go undetected.
Sources: American Diabetes Association — Standards of Medical Care in Diabetes, A1C testing frequency and target recommendations; NIDDK — A1C test information and interpretation; CDC — A1C diabetes management guidance; biochemistry of hemoglobin glycation and A1C-to-average-glucose conversion (Nathan et al., eAG formula); UKPDS (UK Prospective Diabetes Study) — microvascular benefit of HbA1c below 7.0% in Type 2 diabetes; DCCT/EDIC — intensive glycemic control and complication prevention; ACCORD, ADVANCE, and VADT trials — HbA1c target individualization evidence; ADA glycemic individualization framework; A1C limitations in hemoglobinopathies, anemia, and other conditions affecting red blood cell lifespan; fructosamine and glycated albumin as alternative glycemic monitoring tools in A1C-unreliable situations; continuous glucose monitoring time-in-range as a complement to A1C.
Really well-written article on a1c testing schedule. The specific numbers and thresholds mentioned are exactly what I needed to understand my results. This gave me real confidence going into my next specialist appointment.
This breakdown of a1c testing schedule is exactly what patients need before a specialist appointment. I have tried following advice from several sources but this is most consistent with what my specialist told me. Looking forward to reading more articles from this website.
Came across this while researching a1c testing schedule for a family member. I especially valued the explanation of why these recommendations exist, not just what they are. This is going into my health folder that I bring to every doctor’s visit.