
Home Blood Sugar Monitoring Guide
Home blood sugar monitoring is one of the most powerful tools available for managing diabetes and understanding how food, activity, and medications affect glucose. While the A1C test provides the long-term glucose average and clinical lab tests establish diagnosis, home monitoring fills in the day-to-day picture — revealing patterns, guiding treatment decisions, and giving real-time feedback that only becomes available when you have a glucose reading in front of you. This guide covers everything needed to monitor blood sugar effectively at home: choosing the right equipment, mastering testing technique, selecting the most informative times to test, interpreting results, tracking patterns over time, and knowing when readings indicate the need for immediate action. For the reference ranges that put home monitoring results in context, see our blood sugar chart for adults, and for guidance on how often to monitor in different clinical situations, see our guide on how often blood sugar should be checked.
Choosing a Home Glucose Meter
The glucose meter (also called a glucometer or blood glucose monitor) is the primary tool for home blood sugar monitoring. All meters sold in the United States must meet FDA accuracy standards — within ±15% of the true plasma glucose value at glucose concentrations above 75 mg/dL — but in practice, accuracy varies between meters, and technique, strip quality, and storage conditions affect the real-world accuracy of any specific meter. The most important factors to consider when choosing a meter are: insurance coverage of both the meter and its test strips (ongoing strip costs are the primary expense of home monitoring), ease of use (screen readability, required blood volume, step complexity), data management features (Bluetooth connectivity to a smartphone app, memory capacity), and any special features relevant to the individual’s needs (large display for visual impairment, audio output for low vision, no-coding design for simplicity). Test strips are meter-specific and typically cost $0.50–$1.50 per strip without insurance — an important consideration for anyone who will be checking glucose multiple times daily. Most meters are either provided free or at low cost with a prescription when strips are covered by insurance, because the ongoing strip revenue is the business model. Pharmacy staff and diabetes educators can help identify which meters are covered by a specific insurance plan.
A newer category of devices — continuous glucose monitors (CGM) — are increasingly available and provide far more glucose data than traditional fingerstick meters by measuring interstitial glucose every one to five minutes throughout the day and night. CGM sensors are inserted under the skin of the arm or abdomen, typically worn for seven to fourteen days at a time, and transmit readings to a receiver or smartphone app. The advantages of CGM over fingerstick monitoring include the continuous data stream that reveals glucose trends and variability not visible in periodic point-in-time readings, trend arrows showing whether glucose is rising or falling, and alerts for approaching high or low glucose levels. For people with Type 1 diabetes and those with highly variable Type 2 diabetes requiring multiple daily insulin decisions, CGM is now the preferred standard of care as reflected in major diabetes guidelines. CGM requires a prescription and insurance coverage for most people — coverage has expanded significantly in recent years, particularly for insulin users. For anyone for whom CGM is not available or appropriate, a traditional fingerstick meter with structured, well-timed testing provides the most important glucose information needed for management. Understanding the complete range of blood glucose testing options — from the random snap-shot provided by the random blood sugar test to the long-term average from the A1C test — helps put home monitoring in its proper place in the overall glucose assessment picture.
Proper Fingerstick Testing Technique
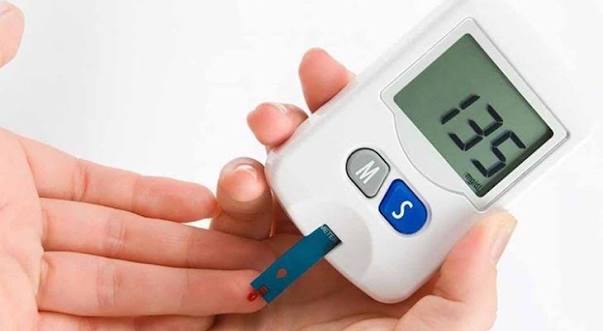
Accurate home glucose readings depend on correct technique. A poorly performed test can produce a reading that is 20–40 mg/dL off from the true glucose level — enough to lead to unnecessary treatment or missed abnormalities. The following steps, followed consistently, maximize the accuracy of home meter readings.
- Wash and dry hands thoroughly. Residue from food (especially fruit juice or sugary drinks) on the finger can be absorbed into the blood sample and falsely elevate the reading by 30–50 mg/dL or more. Plain soap and water, dried completely before testing, is the most reliable preparation. Alcohol swabs are not required if hands are washed and dried, though they can be used when soap and water are not available — but the alcohol must dry completely before lancing to avoid diluting the blood sample.
- Use the side of the fingertip, not the center. The sides of the fingertip have fewer nerve endings than the center and are therefore less painful, while still providing an adequate blood sample. Using the same spot repeatedly causes callus formation that reduces blood flow and makes adequate sample collection harder — rotating between different fingers and different spots on each finger reduces callus buildup.
- Set the lancing device depth appropriately. Lancets used in home glucose testing are spring-loaded to penetrate a set depth. The appropriate depth varies by skin thickness — a lower number setting (shallower penetration) works for thin-skinned individuals; higher numbers are needed for thicker skin or callused fingers. The correct depth produces enough blood for the strip without requiring prolonged squeezing, which can dilute the blood sample with tissue fluid and affect accuracy.
- Allow the blood drop to form without squeezing. After lancing, allow a blood drop to form naturally. If the drop is inadequate, gently “milk” the finger from the base toward the fingertip using steady pressure — but avoid forceful squeezing, which can dilute the blood sample with extracellular fluid. If adequate blood consistently requires forceful squeezing, the lancing depth may need to be increased.
- Apply blood to the strip correctly. Follow the meter-specific instructions for the test strip — most current meters use side-fill strips that draw blood by capillary action when the drop touches the strip edge. Smearing blood across the strip surface (an older method) is not appropriate for side-fill strips. The strip should be inserted in the meter before blood is applied (unless the meter design specifies otherwise).
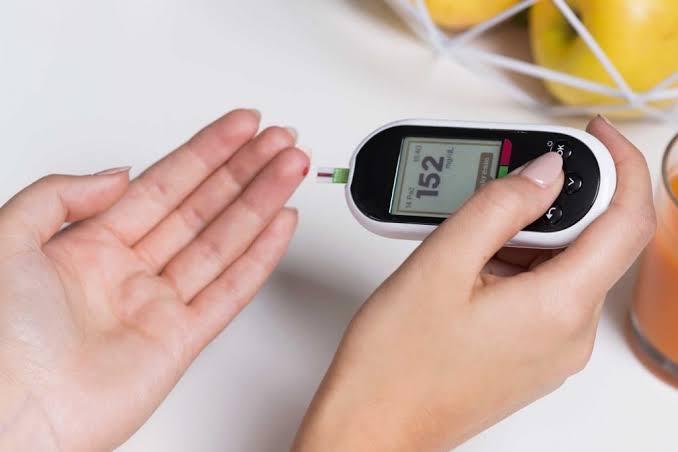
- Read the result and record it. Results are available in five to ten seconds on most modern meters. Record the result along with the time and any relevant context (fasting, two hours after lunch, before exercise, symptomatic). The meter’s memory stores readings automatically, but contextual notes are typically not stored — a paper log or glucose tracking app provides much richer data for pattern analysis than meter memory alone.
- Fasting (morning before eating): Reflects overnight glucose regulation; baseline for the day; most comparable to clinical lab reference ranges
- Before meals (preprandial): Guides insulin dose calculation for insulin users; tracks trend between meals
- Two hours after main meals (postprandial): Reveals how well glucose cleared the meal; most sensitive for detecting early glucose metabolism impairment
- Before bed: Safety check before overnight fast; guides whether a snack or dose adjustment is needed
- During or after exercise: Monitors exercise-related glucose changes; prevents hypoglycemia in insulin/sulfonylurea users
- When symptomatic: Confirms whether symptoms (shakiness, excessive thirst, fatigue, confusion) are glucose-related
- During illness: Detects illness-related glucose elevations; every 2–4 hours during significant acute illness for insulin users
What the Most Important Testing Times Reveal
The timing of a blood glucose reading determines what aspect of glucose metabolism it reflects and how it should be interpreted. Understanding what each testing time reveals — and what it cannot show — helps prioritize which time points are most valuable given the individual’s clinical situation.
Fasting glucose (first thing in the morning before eating or drinking anything other than water): The fasting glucose reflects overnight hepatic glucose production — the liver’s release of glucose into the bloodstream during the overnight fast — balanced against the insulin that suppresses it. Elevated fasting glucose (consistently above 130 mg/dL in a person with diabetes, or above 100 mg/dL in a person without a current diabetes diagnosis) suggests either that overnight insulin is insufficient to suppress hepatic glucose output, or that liver insulin sensitivity is impaired. In insulin users, a consistently elevated fasting glucose usually indicates that the basal insulin dose is too low. Our guide on fasting blood sugar explained covers the physiology and clinical interpretation of fasting glucose in detail.
Post-meal glucose (two hours after the start of the main meal): Post-meal glucose is the most sensitive indicator of how well the body handles dietary carbohydrate. The peak glucose after a mixed meal typically occurs 60–90 minutes after eating; the two-hour value reflects whether glucose has returned close to the pre-meal baseline. A two-hour post-meal glucose above 180 mg/dL in a person with diabetes (or above 140 mg/dL in someone without diabetes) indicates that the post-meal glucose clearance was incomplete — either from inadequate insulin response, too large a carbohydrate load, or impaired insulin sensitivity. Post-meal testing is particularly valuable for understanding how different foods affect glucose in a specific individual, because the response varies significantly by food type and quantity. Our guide on post-meal blood sugar explained provides the full framework for interpreting post-meal glucose readings.
Pre-meal glucose (before eating): For insulin users, the pre-meal glucose reading is needed to calculate the mealtime insulin dose — the higher the pre-meal glucose, the larger the correction component of the dose needed to bring glucose to target before the next meal’s carbohydrate absorption raises it further. For people not on mealtime insulin, pre-meal readings show whether glucose has returned to near-baseline between meals and can identify patterns of glucose remaining elevated for extended periods after meals (suggesting impaired clearance even when the individual has not eaten recently). Understanding what blood sugar is and how it changes throughout the day provides the physiological context that makes these pre-meal versus post-meal differences meaningful rather than arbitrary numbers.
Tracking Patterns and Communicating With Your Healthcare Team
The value of home blood glucose monitoring is not in any individual reading but in the patterns that emerge when readings are compiled over time. A single fasting glucose of 145 mg/dL is one data point; fasting glucose consistently in the 140–155 mg/dL range every morning over two weeks is a pattern that clearly indicates the overnight glucose management needs attention. Pattern recognition requires records — either paper logs with date, time, reading, and brief context notes, or the automatic logging provided by a glucose tracking app or meter with Bluetooth connectivity to a smartphone. Most major diabetes management apps (such as mySugr, Glucose Buddy, and the native apps from major CGM manufacturers) allow users to enter fingerstick readings manually, annotate them with meal and activity context, and generate reports that show glucose patterns visually across the day and week.
These records are also the foundation of productive clinical appointments. A healthcare provider who can see two weeks of structured glucose data in a formatted report — showing average fasting glucose, range of post-meal values, and frequency of readings above or below target — can make much more targeted medication or lifestyle recommendations than one who has only an A1C value from the laboratory. Before each scheduled diabetes care appointment, it is worth preparing a summary of the most recent glucose data: the typical fasting glucose range, any particularly high or low readings and what preceded them, and any time periods when glucose is consistently outside the target range. Our guide on A1C vs blood glucose: what is the difference explains how the home monitoring data and the clinical A1C test complement each other — together providing a picture that neither gives alone. For anyone whose home readings are consistently in a certain pattern and who wants to understand what that pattern means for long-term health outcomes, our guide on why blood sugar matters for long-term health connects specific glucose levels and A1C values to the evidence on complication risk — making the connection between today’s home readings and long-term health outcomes concrete. And for anyone who regularly monitors blood sugar and wants to ensure they are acting appropriately on the results — particularly when readings are very high or low — our guide on when blood sugar symptoms need medical attention provides the complete framework for knowing when home monitoring results require prompt medical attention versus scheduled follow-up. The early signs of high blood sugar and the what diabetes is guides provide further context for understanding what the monitoring data means in terms of the underlying condition being managed — completing the picture of why home blood sugar monitoring is one of the most valuable and empowering tools in diabetes self-care.
Accuracy, Errors, and Troubleshooting
Even with proper technique, several factors can cause home glucose meter readings to be inaccurate. Recognizing these sources of error helps identify when a surprising reading should be rechecked before being acted on, and when a pattern of discrepancy between home readings and A1C results might indicate a systematic measurement problem.
Expired or improperly stored test strips: Test strips have an expiration date, and using strips past their expiration date can produce inaccurate readings — typically falsely low. Strips should also be stored in the original container with the cap tightly closed at room temperature; exposure to high humidity, extreme heat or cold, or bright light can degrade the reactive chemicals on the strip and affect accuracy. Opening a strip package and leaving strips loose (not in the original capped vial) is a common source of measurement error. If a reading seems inconsistent with how you feel or with recent readings, checking the strip expiration date and storage conditions is a useful first step.
Hematocrit effects: Blood glucose meters measure glucose in a fingerstick blood sample, and the glucose concentration in the sample is affected by the proportion of red blood cells in the blood (hematocrit). High hematocrit (polycythemia, dehydration) can cause falsely low glucose readings; low hematocrit (anemia) can cause falsely high readings. This effect varies by meter technology — older meters using reflectance photometry are more susceptible to hematocrit interference than most newer electrochemical meters, which are designed to minimize this effect. For people with significant anemia or conditions that dramatically affect hematocrit, discussing meter accuracy with a healthcare provider is appropriate.
Interfering substances: Some substances can interfere with specific meter technologies. Acetaminophen at high doses, ascorbic acid (Vitamin C) at high supplemental doses, and certain other compounds can affect glucose readings on some meters. Meter package inserts list known interfering substances for that specific device. For people taking high-dose supplements or over-the-counter medications regularly, checking the meter’s package insert for interference information is worthwhile.
Altitude and temperature: At high altitude (above 8,000 feet), some meters may read slightly differently due to the lower partial pressure of oxygen affecting the electrochemical reaction. Extreme temperatures — using the meter outdoors in cold weather or leaving the meter and strips in a hot car — can also affect accuracy. Most meters are designed for use between 50°F and 104°F (10°C and 40°C); operation outside this range is not recommended.
Verifying meter accuracy: All glucose meters come with a control solution — a glucose solution at a known concentration that can be applied to a strip to verify the meter is reading accurately. Using control solution (available at pharmacies) every time a new vial of strips is opened, whenever a reading seems inconsistent with expectations or symptoms, and whenever the meter has been dropped, exposed to extremes, or suspect for any other reason provides a quick confirmation that the meter and strips are functioning correctly. Comparing home meter readings to a laboratory glucose result (collected within a few minutes of the home reading, on the same blood draw occasion) is the gold standard way to verify meter accuracy in the real-world setting — any discrepancy of more than ±15% warrants investigation.
Making Home Monitoring Sustainable Over Time
One of the most common challenges with home blood sugar monitoring is maintaining the routine consistently over months and years. The discomfort of lancets, the burden of scheduling tests around meals and activities, the expense of strips, the emotional weight of seeing high readings, and simple monitoring fatigue can all lead to progressively decreasing testing frequency or selective testing that produces data that is no longer representative. Understanding these challenges and building a sustainable monitoring approach from the outset is as important as knowing the technical aspects of how to test correctly.
Comfort and lancet pain reduction: Modern lancets are very fine gauge (28–33 gauge) and cause minimal pain when used correctly at the appropriate depth setting. Pain is most often caused by using too deep a setting, testing at the center of the fingertip (where nerve density is highest), or reusing lancets (which become dull with each use). A fresh lancet at the correct depth setting, applied to the side of the fingertip, should cause only momentary minor discomfort. Some people find that warming the hands before testing (washing in warm water, or rubbing hands together) improves blood flow and reduces the need for deep lancing. For anyone for whom fingertip testing remains significantly painful, some meters are approved for use with alternate testing sites (forearm, palm) — though these sites respond more slowly to rapid glucose changes and may give results that differ from fingertip testing during the peak and nadir of glucose changes, so their use has specific limitations.
Managing the emotional impact of results: Blood glucose monitoring can produce significant emotional reactions — frustration at unexpectedly high readings, anxiety about repeatedly seeing out-of-range values, or feeling judged by the numbers. Reframing monitoring as a neutral information-gathering activity rather than a test of behavior or willpower can reduce the emotional burden. A reading of 220 mg/dL is not a moral failing — it is information about how that meal, at that time, with current medications, affected glucose. Using that information to make a specific adjustment (eat a smaller portion of that food next time, add a short walk after that meal) makes monitoring purposeful rather than just stressful. Healthcare providers and diabetes educators can help develop personalized strategies for interpreting and responding to results in ways that reduce rather than increase monitoring distress. For context on what different blood glucose readings mean and when they warrant concern versus simply noting for pattern tracking, our blood sugar chart for adults provides clear, non-alarmist reference ranges for different situations and groups. And for the specific question of which readings — combined with what symptoms — indicate a need for same-day or urgent medical attention, our guide on when blood sugar symptoms need medical attention gives clear, actionable guidance that prevents both under-response (ignoring readings that warrant attention) and over-response (making urgent medical calls for readings that are concerning but not emergent). Managing diabetes requires sustained engagement over years and decades — and a home monitoring routine that is practical, sustainable, and emotionally manageable is far more valuable than a technically perfect routine that is abandoned after a few months because it is too burdensome. For the foundational understanding of what diabetes is and why glucose monitoring matters in the larger picture of managing it long-term, our guide on what diabetes is provides the essential context that makes monitoring feel meaningful rather than mechanical, connecting the daily work of testing and tracking to the long-term health outcomes that this effort is protecting.
Sources: American Diabetes Association. Standards of Medical Care in Diabetes — 2024. Diabetes Care. 2024;47(Suppl 1):S20–S42. • Freckmann G, et al. Continuous Glucose Profiles in Healthy Subjects Under Everyday Life Conditions. J Diabetes Sci Technol. 2010;4(5):1157–1164. • Karter AJ, et al. Self-Monitoring of Blood Glucose Levels and Glycemic Control. Diabetes Care. 2006;29(6):1-8.
Finally a resource that explains home blood sugar monitoring guide in plain language. It is refreshing to see an article that acknowledges individual variation rather than one-size-fits-all advice. Keep up this kind of thorough health journalism — it genuinely helps patients like me.
As someone dealing with this personally, the home blood sugar monitoring guide section was very helpful. I appreciated how the article addressed both the clinical side and the practical adjustments. Shared this with three friends who are dealing with related issues. Very useful resource.
I never fully understood home blood sugar monitoring guide until I read this. The article answered questions I didn’t even know I had until I started reading. This is going into my health folder that I bring to every doctor’s visit.