

The connection between sugary drinks and diabetes risk is one of the most strongly established relationships in nutritional epidemiology — prospective cohort studies consistently show that regular consumption of sugar-sweetened beverages independently predicts Type 2 diabetes development at a magnitude that exceeds most individual dietary risk factors. A 2010 meta-analysis of 11 prospective studies found that adults consuming 1–2 servings of sugar-sweetened beverages per day had a 26% higher risk of developing Type 2 diabetes compared to those consuming less than one serving per month — a substantial risk increase driven by a beverage category that provides no nutritional benefit beyond caloric content. The mechanisms connecting sugary drinks and diabetes risk are well-characterized: liquid glucose and fructose from sweetened beverages are absorbed extremely rapidly into the bloodstream (reaching peak blood glucose levels in 15–30 minutes compared to 45–60 minutes for solid carbohydrates), creating sharp blood glucose spikes that stress insulin secretion capacity, promote hepatic fat accumulation through fructose metabolism, increase visceral adiposity, and drive insulin resistance progression through repeated hyperglycemic insult to pancreatic beta cells. For adults managing existing diabetes or prediabetes, the practical guidance is unambiguous — eliminating or dramatically reducing sugar-sweetened beverages is among the highest-impact single dietary changes available, with the potential to meaningfully lower HbA1c and reduce diabetes progression risk within weeks to months of consistent implementation.
A meta-analysis of 17 prospective cohort studies including over 38,000 incident Type 2 diabetes cases found that each additional serving of sugar-sweetened beverages per day was associated with a 13% higher risk of Type 2 diabetes, independent of BMI and other metabolic risk factors. This BMI-independent association indicates that sugary drinks increase diabetes risk through mechanisms beyond the weight gain they cause — including direct fructose hepatotoxicity, gut microbiome disruption, and beta-cell stress from repeated hyperglycemia.
Why Liquid Sugar Is More Harmful Than Solid Sugar for Blood Glucose
A key insight in understanding sugary drinks and diabetes risk is that liquid sugar is metabolically worse than the same quantity of sugar consumed in solid food — several mechanisms explain why beverages deliver a more harmful glycemic hit per gram of sugar than solid carbohydrates:
- No chewing, no satiety signaling: Solid carbohydrate foods must be chewed and mixed with saliva before swallowing, providing mechanical signals that initiate the cephalic-phase digestive response, slow gastric emptying, and trigger appetite-suppression hormones including cholecystokinin and peptide YY. Liquid calories bypass all of these oral processing signals — the stomach does not detect liquid volume the same way it detects solid food mass, gastric emptying of liquids is faster than solids, and the satiety hormones that limit food intake at solid-food meals are triggered poorly by liquid calorie consumption. Adults can easily consume 600+ calories from sugary drinks in a day without experiencing the hunger reduction that would occur from eating an equivalent calorie load in solid food — leading to high total calorie and carbohydrate intake from beverages that simply adds to (rather than substituting for) solid food intake.
- Rapid digestion and absorption — no fiber, no matrix to slow glucose release: The glucose in solid carbohydrate foods is embedded in a food matrix (plant cell walls, starch granule structure, protein networks) that must be enzymatically broken down before the glucose becomes bioavailable for absorption. This structural dismantling takes time and moderates the rate of glucose appearance in the bloodstream — even high-glycemic solid foods like white bread produce a slower glucose peak than beverages with equivalent sugar content. Sugar-sweetened beverages contain free glucose and fructose (from sucrose or high-fructose corn syrup) that require no digestion — they are absorbed directly in the small intestine immediately upon consumption, producing the fastest possible blood glucose spike from any food or beverage.
- High-fructose corn syrup and hepatic fructose overload: Most sugar-sweetened beverages in the United States use high-fructose corn syrup (HFCS) rather than table sugar (sucrose) — and the fructose component of HFCS (typically 55% fructose in beverages) is metabolized exclusively by the liver, where it is rapidly converted to fat through de novo lipogenesis. High fructose intake from beverages overloads hepatic fructose metabolism, promoting non-alcoholic fatty liver disease (NAFLD), increasing hepatic fat accumulation, and driving hepatic insulin resistance — the hepatic component of insulin resistance that impairs the liver’s response to insulin’s signal to suppress glucose production. Adults with high sugary beverage consumption frequently develop NAFLD at higher rates than those consuming equivalent calories from non-fructose sources, and NAFLD is a significant driver of the insulin resistance that precedes and accompanies Type 2 diabetes development.
- Volume capacity — the ease of consuming large amounts quickly: Drinking is faster than eating. An adult can consume a 44oz (1.3L) fountain soda in 10–15 minutes — delivering 128g of sugar and 500 calories in a format that produces minimal satiety. Eating an equivalent amount of calories in solid sugar-rich food would be uncomfortable and slow enough to trigger satiety signals before completion. The behavioral ease of drinking large volumes makes sugary beverages uniquely efficient calorie delivery vehicles that exceed what the body’s natural appetite regulatory systems evolved to handle from liquid intake.
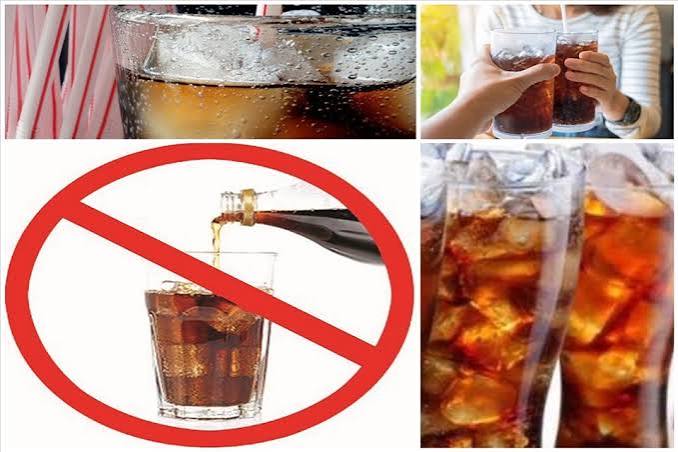
The Worst Offenders: Sugar Content in Common Beverages
Understanding the actual sugar content of commonly consumed beverages puts the sugary drinks and diabetes risk relationship in practical context — many adults dramatically underestimate how much sugar common beverages contain:
- Regular soda (12oz can): 39g sugar (9.75 tsp). A standard 12oz can of Coca-Cola contains 39g of sugar — equivalent to almost 10 teaspoons of sugar in a single serving. A 20oz convenience store bottle contains 65g; a 44oz fountain drink contains approximately 128g of sugar — amounts that would be extraordinary and obvious if presented as solid sugar but that are consumed routinely when delivered in liquid form. Adults managing diabetes who consume even one can of regular soda daily are adding 39g of rapidly absorbed sugar to their daily carbohydrate load — an amount that alone would be expected to meaningfully worsen HbA1c over weeks to months of consistent consumption.
- Fruit juice (8oz glass): 24–36g sugar. Orange juice, apple juice, grape juice, and other 100% fruit juices are often perceived as healthy due to their vitamin content, but they deliver concentrated sugar without the fiber that slows glucose absorption in whole fruit. An 8oz glass of orange juice contains 24g of sugar (comparable to a small soda); grape juice provides 36g per 8oz — among the highest sugar concentrations of any common beverage. The vitamin C and potassium in fruit juice do not offset the glycemic harm for adults with diabetes or prediabetes — whole fruit provides equivalent nutrients with the fiber that moderates blood glucose impact, making whole fruit dramatically preferable to juice for blood sugar management.
- Sweetened iced tea and lemonade: 22–44g sugar per 16oz. Restaurant and commercial sweetened iced tea (Arizona Iced Tea, Snapple, fountain sweet tea) typically contains 22–44g of sugar per 16oz serving — comparable to soda. Sweet tea is often consumed in larger quantities than soda at meals, and is frequently perceived as a healthier alternative to soda despite its similar sugar content. Commercial lemonade contains 29–44g of sugar per 16oz serving — most of the sweetness comes from added sugar rather than the naturally tart lemon juice, making lemonade effectively a sweetened beverage in the same category as soda for blood sugar purposes.
- Sports drinks and energy drinks: 21–54g sugar per serving. Gatorade and other sports drinks contain 21g of sugar per 20oz bottle (less than soda, but still substantial) and are frequently consumed by non-athletes in non-exercise contexts where the electrolyte and carbohydrate content provides no performance benefit — simply adding unnecessary sugar. Energy drinks (Red Bull, Monster, Rockstar) contain 27–54g of sugar per can alongside high caffeine — a combination that produces substantial blood glucose elevation alongside the cortisol and adrenaline release from caffeine. Sugar-free energy drink versions avoid the glucose problem but retain the high caffeine dose that can elevate blood glucose through cortisol and adrenaline release in people with diabetes.
- Flavored coffee drinks and blended beverages: 40–80g sugar. Specialty coffee beverages from chain coffee shops (Frappuccinos, flavored lattes, sweetened macchiatos) commonly contain 40–80g of sugar from flavoring syrups, sweetened milk bases, chocolate sauce, and whipped cream — placing them among the highest sugar-per-serving beverages available. An adult who visits a coffee chain daily and orders a medium flavored Frappuccino may be consuming 60–70g of sugar in that single beverage — more sugar than many people consume across an entire meal. The beverage choices that support blood sugar management rather than harm it are covered in detail in our guides on tea and blood sugar and coffee and blood sugar. The role of artificial sweeteners in diet beverages as partial alternatives to sugary drinks is covered in our artificial sweeteners and blood sugar guide. The American Diabetes Association’s nutrition guidance, the NIDDK’s diabetes diet guidance, and the CDC’s diabetes prevention eating guide all identify reducing sugar-sweetened beverages as among the most impactful single dietary changes for blood sugar management and diabetes prevention — making unsweetened beverages the definitive recommendation for adults managing glucose and metabolic health. The complete dietary framework for blood sugar management — integrating beverage choice within a comprehensive nutritional approach that includes optimal food selection, meal timing, and pattern — is covered in our diabetes diet beginner’s guide and our best foods for blood sugar control overview.
How Much Does Reducing Sugary Drinks Actually Improve Blood Sugar?
The clinical question most relevant to adults managing diabetes is not whether sugary drinks and diabetes risk are linked — the epidemiological evidence is unambiguous — but how much measurable improvement in blood sugar can realistically be expected when sugary drink consumption is eliminated or dramatically reduced. The interventional evidence provides specific, quantifiable answers that underscore why beverage modification is such a high-priority diabetes management tool:
- HbA1c reduction from eliminating daily soda: Adults with Type 2 diabetes who consume 1–2 cans of regular soda per day and stop completely can expect HbA1c reductions of 0.5–1.2 percentage points over 8–12 weeks based on the carbohydrate reduction alone — equivalent to the effect of some oral diabetes medications. An adult consuming 2 cans of regular soda per day is consuming 78g of sugar from beverages alone; eliminating those 78g of rapidly absorbed sugar removes a daily glycemic challenge that would otherwise require continuous insulin or medication response. The HbA1c improvement from beverage elimination is one of the cleanest interventions available because it requires no complex dietary calculation — simply not drinking something that was previously being drunk.
- Fasting glucose improvement within days: Unlike dietary changes that produce gradual metabolic improvement, eliminating sugary beverages produces measurable fasting glucose reduction within days because it immediately removes a source of daily blood sugar elevation that was regularly spiking glucose. Adults who track blood glucose with a glucometer or CGM when they stop daily soda consumption typically see their morning fasting glucose improve within the first week as the liver’s glycogen store and hepatic fat content begin to normalize without the daily fructose overload from HFCS.
- Weight loss from beverage elimination: Sugar-sweetened beverages contribute to weight gain through their poor satiety despite high calorie content. Adults replacing 2 daily sodas (approximately 300 calories) with zero-calorie beverages (water, unsweetened tea) while maintaining otherwise constant diet typically lose 0.5–1 pound per week from the calorie reduction alone — and this weight loss contributes to additional insulin sensitivity improvement and HbA1c reduction beyond the direct effect of removing the sugar spikes. The weight loss from beverage elimination tends to be the most durable caloric reduction strategy available because beverages are categorically easy to replace (there are good tasting zero-calorie alternatives like unsweetened tea), unlike removing solid foods which often involves palatability trade-offs.
- Liver fat reduction: High fructose intake from sugar-sweetened beverages is a primary driver of NAFLD (non-alcoholic fatty liver disease) in adults with metabolic syndrome. Eliminating HFCS from beverages reduces the hepatic fructose burden that drives de novo lipogenesis and liver fat accumulation. Clinical studies of fructose-restricted diets show measurable reductions in liver fat on MRI imaging within 8–12 weeks — and liver fat reduction is associated with significant improvement in hepatic insulin resistance and reduction in fasting glucose, providing a mechanism for the rapid fasting glucose improvements observed when high-fructose beverage consumption is stopped.
Best Replacement Beverages for Blood Sugar Management
Knowing that sugary drinks and diabetes risk are linked does not help adults unless they have practical, palatable alternatives. The hierarchy of replacement beverages for blood sugar management from most to least beneficial:
- Plain water (best default): Water has zero calories, zero carbohydrates, zero blood glucose impact, and no concerns about artificial sweeteners, gut microbiome effects, or cephalic-phase insulin release. Adults who successfully replace all sugary beverages with water achieve the optimal combination of removing liquid sugar harm while adding a completely neutral alternative. The primary barrier is palatability — water is less satisfying than sweetened beverages for adults accustomed to highly sweetened drinks, making a gradual transition (diluting sugary drinks progressively with water over 2–4 weeks) more sustainable than an abrupt switch for some people. Sparkling water (plain or with natural fruit flavoring, no added sugar) provides a textural substitute for carbonated soda that many adults find easier to adapt to than flat water.
- Unsweetened green or black tea: Unsweetened tea is arguably the best overall replacement for sugary drinks for adults with diabetes — it provides zero-calorie zero-sugar hydration with the added benefit of blood-sugar-beneficial polyphenols (EGCG in green tea, theaflavins in black tea) that improve insulin sensitivity and reduce long-term diabetes risk. The switch from sweetened iced tea to unsweetened iced tea (home-brewed cold brew green or black tea) maintains the refreshing cold beverage experience while eliminating the 22–44g of sugar per serving that makes commercial sweetened iced tea equivalent to soda for blood glucose impact. Adults who make this single switch — from commercial sweet tea or fruit-flavored tea to homemade unsweetened iced tea — report among the easiest positive dietary changes for diabetes management, particularly in warm weather climates where cold beverages are consumed frequently. Our tea and blood sugar guide covers the evidence for tea polyphenols and blood glucose in detail.
- Unsweetened black coffee or espresso: For adults who enjoy coffee, unsweetened black coffee or espresso provides the same zero-calorie zero-sugar benefit as water alongside chlorogenic acids associated with long-term diabetes risk reduction. The key is “unsweetened” — adding syrups, sugar, or flavored creamers to coffee recreates the sugary beverage problem the switch was meant to solve. Black coffee and Americano espresso drinks from coffee shops are excellent choices; flavored sweetened coffee drinks should be avoided for the same reasons as soda. Our coffee and blood sugar guide covers the nuanced relationship between coffee and blood sugar in detail, including how caffeinated coffee can transiently raise blood glucose in people with existing Type 2 diabetes despite its long-term protective association.
- Unsweetened plant-based milk (for flavor variety): Unsweetened almond milk (30–40 calories per cup, 1–2g carbohydrates), unsweetened soy milk (80–90 calories, 4g carbohydrates), and unsweetened coconut milk beverage (45 calories, 1–2g carbohydrates) provide flavor variety and some nutritional content with minimal blood glucose impact compared to juice, flavored milk, or oat milk (which has more carbohydrates even unsweetened due to its starchy base). These plant milks work well as coffee bases, smoothie bases, or standalone beverages for adults who want variety beyond water and tea. The critical specification is “unsweetened” — sweetened versions of all plant milks contain 5–20g of added sugar per serving.
- Diet beverages (transitional step, not ideal final destination): For adults making the transition from regular soda consumption, diet sodas and artificially sweetened beverages represent a meaningful improvement over regular soda (eliminating the direct glucose harm from sugar) while still providing the carbonated sweet experience that makes regular soda appealing. As a transitional measure, switching to diet soda reduces HbA1c compared to continued regular soda consumption. As a long-term strategy, the evidence supports moving further toward water and unsweetened tea as the final destination, as artificially sweetened beverages carry their own concerns around gut microbiome effects and appetite dysregulation at high consumption levels. Our artificial sweeteners and blood sugar guide covers the specific safety profiles of different sweeteners used in diet beverages. The ADA’s beverage guidance, the NIDDK’s eating guidance for diabetes, and the CDC’s diabetes prevention eating resources all identify drinking water, unsweetened tea, and unsweetened coffee in place of sugary beverages as one of the single highest-impact dietary changes available to adults managing blood sugar and reducing diabetes risk. The complete dietary approach that integrates beverage choice alongside food selection, meal composition, and overall eating pattern for comprehensive blood glucose management is covered in our diabetes diet beginner’s guide and our best foods for blood sugar control overview.
Reading Labels: How to Identify Hidden Sugar in Beverages
A practical skill for adults managing sugary drinks and diabetes risk is reading beverage labels accurately — sugar is listed under several names that may not be immediately recognizable as sugar, and serving sizes on labels are often smaller than the actual portion consumed:
- Common sugar names on ingredient labels: High-fructose corn syrup, sucrose, dextrose, maltose, glucose syrup, evaporated cane juice, fruit juice concentrate, agave nectar, honey, brown rice syrup, and molasses are all added sugars that raise blood glucose equivalently to table sugar despite their different names. When any of these appear in the first few ingredients of a beverage, the product is a sugar-sweetened beverage regardless of how it is marketed — terms like “natural,” “organic,” “fruit-based,” or “real sugar” do not make the glycemic impact of the sweetener less harmful for blood sugar management. Adults who regularly read ingredient lists and check the “Added Sugars” line on the Nutrition Facts panel quickly develop the ability to categorize beverages accurately based on their actual composition rather than their marketing narrative.
- Serving size deception in beverage containers: Many beverage containers are labeled with a serving size of 8oz while the bottle or can contains 20oz — so a “20g sugar per serving” label actually means 50g of sugar if the full bottle is consumed (as most adults do in one sitting). Always multiply the per-serving sugar by the number of servings in the container when evaluating a beverage’s actual blood sugar impact. A beverage labeled “2.5 servings per container, 16g sugar per serving” delivers 40g of total sugar if the full container is consumed — the same as a regular soda. The FDA’s 2020 Nutrition Facts label update requires that containers between 1 and 2 serving sizes show a “Per container” column alongside the “Per serving” column, making this calculation more transparent, but many beverages still require manual multiplication to understand their actual total sugar content.
Sources: American Diabetes Association — beverage choices and blood sugar management; NIDDK — diabetes dietary guidance; meta-analysis of sugar-sweetened beverage consumption and Type 2 diabetes risk (17 prospective studies); research on liquid vs solid sugar absorption rates and postprandial glucose response; fructose and hepatic fat accumulation mechanism; HFCS composition and metabolic effects; CDC diabetes prevention nutrition guidance; beverage sugar content data from USDA nutrition database.
I shared this article on sugary drinks and diabetes risk with my doctor and they appreciated the level of detail. It is refreshing to see an article that acknowledges individual variation rather than one-size-fits-all advice. Keep up this kind of thorough health journalism — it genuinely helps patients like me.
Really well-written article on sugary drinks and diabetes risk. It is refreshing to see an article that acknowledges individual variation rather than one-size-fits-all advice. Thank you for making complex medical information accessible without dumbing it down.
Bookmarked this article on sugary drinks and diabetes risk immediately — going to reference it regularly. I have tried following advice from several sources but this is most consistent with what my specialist told me. Forwarding this to others in my support group who are dealing with similar issues.