
Processed Foods and Kidney Health
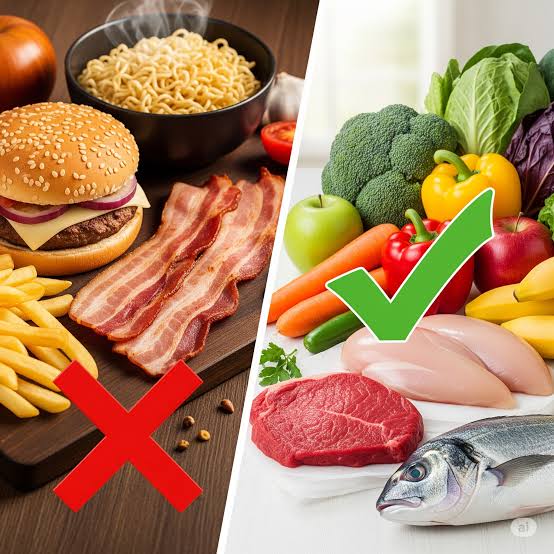
Ultra-processed foods — factory-manufactured products with multiple ingredients including preservatives, artificial flavors, colors, emulsifiers, and texturizers that would not be found in a home kitchen — now account for more than 50% of daily calorie intake for the average American adult and up to 70% for adolescents. For kidney health, this dietary shift is consequential: ultra-processed foods are the primary vehicle for the three most damaging dietary factors in CKD — excess sodium, added sugar, and phosphate additives — while simultaneously being low in the fiber, potassium, and antioxidants that characterize kidney-protective dietary patterns. Understanding which processed foods are most harmful, how processing changes the composition of foods in kidney-relevant ways, and how to restructure eating patterns around less-processed options is increasingly central to CKD prevention and management.
The NOVA classification system, developed by Brazilian nutrition researchers, categorizes foods into four groups by degree of processing: unprocessed or minimally processed foods (group 1), processed culinary ingredients (group 2), processed foods (group 3), and ultra-processed food and drink products (group 4). Research consistently shows that higher NOVA group 4 intake is associated with greater cardiovascular risk, obesity, type 2 diabetes — and increasingly, with CKD development and faster progression in established kidney disease.
How Processed Foods Harm the Kidneys
Ultra-processed foods damage kidneys through several distinct mechanisms, each of which is amplified in patients with existing kidney disease.
Sodium overload. The most immediate mechanism is sodium: ultra-processed foods account for approximately 70–75% of dietary sodium intake for most Americans. A single frozen meal may contain 1,200–2,000 mg of sodium; a serving of canned soup 800–1,200 mg; two slices of deli meat 600–900 mg. For CKD patients with a target of 2,000 mg per day, a single meal from ultra-processed foods can consume the entire daily allowance. Chronic sodium excess drives glomerular hypertension, volume overload, RAAS activation, and profibrotic signaling — the central mechanisms of CKD progression covered in detail in the salt and kidney health guide. The salt and kidney health guide covers the sodium mechanisms in detail.
Phosphate additives: a specific processed food risk. Inorganic phosphate additives — used as preservatives, emulsifiers, flavor enhancers, and leavening agents in processed meats, soft drinks, baked goods, and fast food — are absorbed with dramatically higher efficiency than organic phosphate naturally present in whole foods. Organic phosphate in beans, nuts, and whole grains is bound to phytate and absorbed at only 40–60% efficiency; inorganic phosphate additives are absorbed at 90–100% efficiency. For CKD patients who cannot efficiently excrete phosphate (due to reduced GFR and impaired FGF-23 signaling), this superior absorption makes additive phosphate disproportionately dangerous relative to naturally occurring phosphate from whole foods. Elevated blood phosphate (hyperphosphatemia) in CKD promotes vascular calcification, secondary hyperparathyroidism, and renal osteodystrophy — and is independently associated with mortality in dialysis patients. The NIDDK dietary guidance for CKD specifically addresses phosphate from processed foods as distinct from natural food phosphate.
Added sugar and fructose. Ultra-processed foods are the primary delivery mechanism for high-fructose corn syrup and other added sugars in the American diet. Sweetened beverages, flavored yogurts, breakfast cereals, granola bars, and packaged snacks deliver added sugar in quantities that produce the fructose-uric acid pathway, AGE formation, and metabolic syndrome effects that independently damage kidneys. The kidney-specific effects of sugar consumption are addressed separately in the sugar and kidney health guide.
Gut microbiome disruption. Ultra-processed foods are low in dietary fiber and high in emulsifiers — compounds like carboxymethylcellulose and polysorbate 80 that are added to maintain texture and shelf life. Both fiber deficiency and emulsifier consumption reduce the diversity and abundance of beneficial gut bacteria that produce short-chain fatty acids (butyrate, propionate, acetate). In CKD, gut dysbiosis — the imbalanced microbiome that results — is a major driver of uremic toxin generation: gut bacteria ferment amino acids from undigested protein to produce indoxyl sulfate and p-cresyl sulfate, compounds that directly damage tubular cells, promote renal fibrosis, and are associated with faster GFR decline. Moving from a processed-food-dominant diet to one rich in plant fiber shifts the gut microbiome toward butyrate-producing bacteria, reduces uremic toxin generation, and may reduce the inflammatory burden on CKD kidneys.
Phosphate in Processed Foods: The Hidden Kidney Risk
Phosphate in food is one of the most important and least understood kidney concerns in the modern diet. The distinction between naturally occurring phosphate and additive phosphate is clinically significant but invisible on most nutrition labels — both are listed under the same “phosphorus” category when nutrition facts are provided at all (and many processed foods, particularly fast foods, do not provide phosphorus content on labels).
The most common phosphate additives appear on ingredient lists under names such as: sodium phosphate, dicalcium phosphate, trisodium phosphate, sodium hexametaphosphate, sodium acid pyrophosphate, calcium phosphate, and phosphoric acid (in cola drinks). Identifying these on labels — and choosing products without them — is a practical phosphate-reduction strategy for CKD patients who are restricting phosphate intake. Products that contain these additives include processed meats (hot dogs, sausage, deli meats), packaged cheese products (processed cheese slices, cheese spreads), many fast-food proteins (where phosphate is injected to retain moisture and improve flavor), cola soft drinks (phosphoric acid), commercial baked goods, and many frozen meals.
For CKD patients in stages 3b–5, phosphate restriction is a standard component of dietary management. The key practical strategies: reading ingredient lists for phosphate-containing additives (not just the nutrition label), choosing fresh proteins (unprocessed chicken, fish, eggs) over processed meats, using real dairy (milk, yogurt, natural cheese) over processed cheese products (which have much higher additive phosphate), and limiting cola beverages. The National Kidney Foundation provides comprehensive phosphate management guidance for each CKD stage.
Ultra-Processed Foods and CKD Risk: The Observational Evidence
Multiple large observational studies have specifically examined ultra-processed food intake and kidney health outcomes, consistently finding higher risk associated with greater consumption.
A 2021 study published in the Clinical Journal of the American Society of Nephrology (CJASN) analyzed data from the ARIC (Atherosclerosis Risk in Communities) cohort — a prospective study of more than 14,000 middle-aged adults followed for up to 24 years. Participants in the highest quartile of ultra-processed food consumption had a 24% higher risk of incident CKD compared to those in the lowest quartile, after adjusting for total caloric intake, physical activity, education, and other dietary factors. The association was not fully explained by the individual dietary components (sodium, sugar, fiber) but suggested additional mechanisms from the overall ultra-processed dietary pattern — including potentially direct effects of food additives, emulsifiers, and contaminants from food contact materials.
A complementary analysis from the PREDIMED-Plus study found that higher adherence to a Mediterranean-style diet — which emphasizes minimally processed whole foods — was associated with significantly lower CKD incidence and slower GFR decline compared to a Western dietary pattern high in ultra-processed foods. The effect was consistent across participants with and without diabetes, suggesting that the benefit of minimally processed dietary patterns on kidney health extends beyond glycemic control. The protective framework of dietary choices for kidney health is addressed in the kidney disease prevention guide.
Practical Guide to Reducing Ultra-Processed Food Intake
Reducing ultra-processed food intake does not require a complete dietary overhaul. Targeted substitutions — replacing the highest-impact processed foods with minimally processed equivalents — produce meaningful changes in sodium, phosphate, sugar, and fiber intake without requiring patients to cook every meal from scratch or abandon familiar eating patterns.
High-priority substitutions:
- Deli meat → fresh protein: Replace processed lunch meats (which contain sodium and phosphate additives) with roasted chicken breast, hard-boiled eggs, or canned tuna (in water, low-sodium). The sodium reduction from this single change can be 500–800 mg per day for regular deli meat consumers.
- Canned soup → homemade or low-sodium options: Regular canned soup provides 800–1,200 mg sodium per serving. Low-sodium versions, or soups made from unsalted broth and fresh vegetables, provide flavor with a fraction of the sodium and no phosphate additives.
- Processed cheese → natural cheese in moderate amounts: Processed cheese products (American slices, Velveeta, cheese spreads) are high in phosphate additives. Natural cheeses (cheddar, Swiss, fresh mozzarella) have naturally occurring phosphate at lower absorption rates and lower total additive content.
- Packaged snacks → whole food snacks: Replace crackers, chips, and granola bars with fresh fruit, raw vegetables, unsalted nuts, or plain yogurt. This reduces sodium, added sugar, and phosphate additives simultaneously while increasing fiber and potassium (for patients without hyperkalemia).
- Cola drinks → water, unsweetened tea, or sparkling water: Cola drinks contain phosphoric acid, added sugar or artificial sweeteners, and are associated with kidney disease risk on multiple pathways. This substitution addresses phosphate, sugar, and potential acidosis contributions simultaneously.
For CKD patients managing multiple dietary restrictions simultaneously — sodium, phosphate, potassium, protein, and fluid — working with a renal dietitian to identify the specific processed foods contributing the most to each restricted nutrient produces a targeted reduction strategy that is more achievable than a generic instruction to “eat less processed food.” The guide to slowing kidney disease progression places dietary modification — including reducing processed food intake — within the integrated framework of disease-modifying management for CKD. The American Heart Association’s guidance on whole foods and dietary fiber complements the kidney-specific dietary approach by addressing the cardiovascular risk reduction that overlaps substantially with kidney protection in CKD patients.
Conclusion
Ultra-processed foods damage kidneys through multiple converging pathways: sodium excess that drives glomerular hypertension, highly absorbable phosphate additives that cause hyperphosphatemia in CKD, added sugar that promotes AGE formation and uric acid generation, and gut microbiome disruption that increases uremic toxin production. The epidemiological evidence consistently shows a 20–25% higher CKD risk with the highest ultra-processed food intake, and the mechanisms explain why food processing — beyond the individual nutrients it delivers — matters for kidney health. Practical reduction strategies focus on the specific high-impact substitutions — deli meat to fresh protein, processed cheese to natural cheese, canned soup to low-sodium alternatives, cola drinks to water — that produce the largest change in kidney-relevant dietary exposures with the most manageable disruption to existing eating patterns.
Reading Labels for Kidney Health: A Practical Approach
Effective label reading for CKD patients requires looking at three separate components of a food package: the nutrition facts panel (for sodium, phosphorus if listed, and added sugar per serving), the ingredient list (for phosphate additive names, sodium compounds, and sugar synonyms), and the serving size (which determines whether the nutrition facts numbers apply to how much you actually eat). Many patients read only one of these, which can lead to significant underestimation of kidney-relevant content.
Sodium on the nutrition facts panel: look for milligrams (mg) per serving, and check whether the serving size reflects actual consumption. A can of soup often lists nutrition facts for half a can — if the patient eats the whole can, the sodium doubles. For CKD patients targeting 2,000 mg per day, a simple daily rule is to aim for foods averaging no more than 200–300 mg per serving, with the understanding that some items (bread, condiments) will be lower and some higher.
Phosphate on the nutrition facts panel: phosphorus content is listed on some food labels, particularly those with high natural or additive phosphate, but it is not universally required. When it is absent, the ingredient list is the primary tool for identifying additive phosphate. Any ingredient name ending in “-phosphate” (sodium phosphate, dicalcium phosphate, potassium phosphate, monocalcium phosphate) or containing “pyrophosphate” or “polyphosphate” indicates inorganic phosphate additives. Phosphoric acid (listed simply as “phosphoric acid”) appears in cola beverages. The presence of any of these in a processed food indicates high-efficiency additive phosphate that CKD patients in stages 3b–5 should minimize.
Added sugar on the nutrition facts panel: the “Added Sugars” line — introduced in the 2016 FDA nutrition label update — distinguishes sugars added during processing from naturally occurring sugars in fruit or dairy. For CKD patients, the total from added sugar should remain below 25 grams per day (the American Heart Association recommendation for women; 36 g for men), with the understanding that fructose-containing sweeteners (high-fructose corn syrup, agave, fructose) contribute to uric acid generation even when total added sugar is moderate. The ingredient list reveals which specific sugars are present; high-fructose corn syrup, agave syrup, and fructose specifically carry the fructose-uric acid kidney risk, while sucrose (table sugar) contributes equal glucose and fructose. The salt and kidney health guide provides sodium label-reading strategies in detail.
Building a Kidney-Friendly Pantry: Long-Term Strategies
Reducing ultra-processed food dependence is most sustainable when approached as a gradual transition over weeks and months rather than an abrupt elimination. The goal is to shift the default pantry — the foods that are always available and require the least effort to prepare — from ultra-processed items to minimally processed equivalents that are as convenient but substantially lower in kidney-harmful additives.
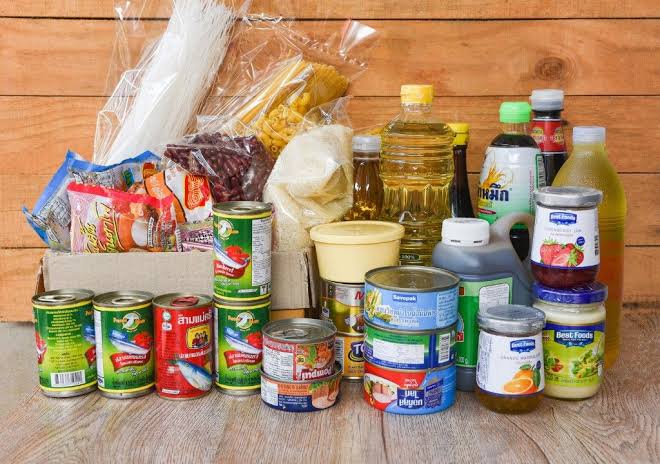
A kidney-friendly pantry core includes: dried or canned (low-sodium) legumes (lentils, chickpeas, kidney beans, black beans), whole grains (oats, brown rice, quinoa, barley), unsalted nuts and seeds, olive oil and other healthy cooking fats, canned fish in water (tuna, salmon, sardines without sauce), frozen vegetables (unseasoned), unsalted or low-sodium canned tomatoes, and a collection of sodium-free herbs and spices. These items provide protein, fiber, complex carbohydrates, and healthy fats without the sodium, phosphate additives, and added sugar of their ultra-processed counterparts — and they can be assembled into satisfying meals with modest cooking skill.
The transition approach: identify the three ultra-processed foods that contribute the most sodium, phosphate, or sugar to current intake (often deli meat, canned soup, or processed cheese) and replace each one at a time over a three-week period. Each replacement simultaneously reduces kidney-harmful additives and introduces a more nutritionally dense option. This staged approach avoids the overwhelm of attempting a complete dietary overhaul, builds cooking confidence with each new item, and produces measurable changes in sodium and phosphate intake that can be tracked through periodic laboratory monitoring. The kidney disease prevention guide places dietary modification within the full integrated framework of CKD prevention and management. For patients at the stage where dietary changes interact with medication adjustments and dialysis planning, the advanced kidney disease monitoring guide addresses how dietary management integrates with the complete care framework at stages 4 and 5.
Restaurant Meals, Takeout, and Kidney Health
Restaurant and takeout meals present the most challenging sodium and phosphate management scenario for CKD patients because nutritional information is often unavailable, portion sizes are large, and sodium is used liberally in commercial cooking to enhance flavor at scale. A typical restaurant entree — grilled chicken, pasta, steak, or a burger — commonly contains 1,500–3,500 mg of sodium, with sauces, seasonings, marinades, and cooking salt contributing amounts that no home cook would add to the same dish. For a CKD patient with a daily target of 2,000 mg, a single restaurant meal can consume 75–175% of the entire day’s allowance, making it nearly impossible to stay within target if restaurant meals are regular occurrences.
Practical strategies for restaurant eating with CKD: request that sauces, dressings, and marinades be served on the side (eliminating the largest individual sodium contributor in most restaurant dishes); choose grilled, roasted, or steamed proteins over fried, breaded, or sauced preparations; ask whether the kitchen can prepare a portion without added salt (a reasonable request at full-service restaurants); choose dishes with simpler preparation — a grilled salmon fillet with vegetables contains far less hidden sodium than a chicken dish with sauce, marinade, and seasoning blend; and use the meal as a data point, not a failure, if it results in elevated blood pressure or swelling the next day, adjusting subsequent meals accordingly.
Many chain restaurants publish full nutritional information — including sodium content — on their websites or through apps, which allows patients to select lower-sodium options before arriving at the restaurant. For those without published data, ethnic cuisines vary dramatically in typical sodium content: Japanese sushi (without soy sauce) and grilled preparations are lower; Chinese takeout, Thai curries, and heavily sauced dishes typically very high. When eating out cannot be avoided, choosing the simplest preparation of a single protein with unseasoned sides and asking for extra water throughout the meal helps manage the sodium load from a CKD perspective.
The Connection Between Processed Food Reduction and CKD Medication Effectiveness
One of the underappreciated benefits of reducing ultra-processed food intake is its effect on the medications used to manage CKD. ACE inhibitors and ARBs — the first-line medications for CKD with proteinuria or hypertension — are significantly more effective in patients with lower dietary sodium intake, because the RAAS suppression these drugs provide is blunted by high sodium intake. A CKD patient eating 3,500–4,000 mg of sodium per day, primarily from ultra-processed foods, may experience only partial blood pressure and proteinuria reduction from their medication; the same patient achieving 1,800–2,000 mg through reduced processed food intake may achieve full target blood pressure with lower medication doses, or may require fewer antihypertensive agents to achieve control.
Similarly, phosphate binders — medications used in stages 4–5 CKD and dialysis to reduce phosphate absorption from food — have limited effectiveness against the inorganic phosphate in processed foods because the absorption of inorganic phosphate occurs so rapidly that it partially bypasses the binding mechanism. Reducing additive phosphate in the diet reduces the load that phosphate binders must handle, potentially allowing lower medication doses and reducing the side effects associated with higher binder doses (particularly constipation from calcium-based binders). Dietary processed food reduction and pharmacological management of CKD are therefore complementary rather than competing strategies — food choices that reduce processed food intake make the medications work better, and medications are most effective when the dietary foundation of CKD management is in place. This integrated approach to CKD management — dietary, lifestyle, and pharmacological — is addressed in the guide to slowing kidney disease progression.
The dietary modifications that protect kidney function — reducing sodium, phosphate additives, added sugar, and ultra-processed foods; increasing fiber, whole foods, and plant proteins — are achievable with sustained effort and appropriate support. They do not require perfect execution at every meal, but they do require consistent awareness of where the most kidney-harmful dietary exposures are concentrated and a commitment to gradually replacing those sources with more kidney-compatible alternatives. For patients who find this overwhelming, the most practical starting point is a single change: eliminating regular consumption of the one food or beverage that contributes the most sodium or phosphate additives to current intake. That single substitution — done consistently — produces measurable laboratory and blood pressure changes that provide both motivation and evidence that dietary choices are having their intended kidney-protective effect. Building from there, one substitution at a time, is the most evidence-consistent path to a dietary pattern that reduces the cumulative kidney burden of ultra-processed food consumption over the long timescale of CKD progression.
Sources: National Kidney Foundation (kidney.org); NIDDK (niddk.nih.gov); American Heart Association (heart.org); Canhada SL et al., “Ultra-Processed Food Consumption and Incident Chronic Kidney Disease,” CJASN 2021; Monteiro CA et al., NOVA classification, Public Health Nutrition 2019; KDIGO CKD Clinical Practice Guidelines 2012/2024.
Finally a resource that explains processed foods and kidney health in plain language. I appreciated how the article addressed both the clinical side and the practical adjustments. Appreciate the effort that went into researching and writing this — it shows.
I never fully understood processed foods and kidney health until I read this. The specific numbers and thresholds mentioned are exactly what I needed to understand my results. Shared this with three friends who are dealing with related issues. Very useful resource.
This breakdown of processed foods and kidney health is exactly what patients need before a specialist appointment. The practical tips made this immediately actionable, not just theoretical. Looking forward to reading more articles from this website.