
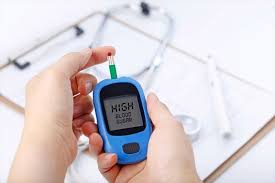
Blood sugar log templates are among the simplest and most practically useful tools in diabetes self-management — yet they are often used inconsistently, incompletely, or in formats that make the data difficult to review meaningfully. The difference between a log that helps and one that does not is not the paper or the app it is recorded on — it is what information is recorded alongside glucose readings, and whether the records are reviewed in a way that surfaces patterns. A glucose reading of 210 mg/dL means very different things depending on whether it was measured two hours after a large pasta dinner, during a period of unusual work stress, on a morning when a medication dose was missed, or in the absence of any apparent cause. Without context, it is a number. With context, it is a data point that informs a management decision. This guide covers what information belongs in a blood sugar log, how to structure log entries for maximum clinical usefulness, the difference between paper and digital log formats, and how to use log data before care team appointments.
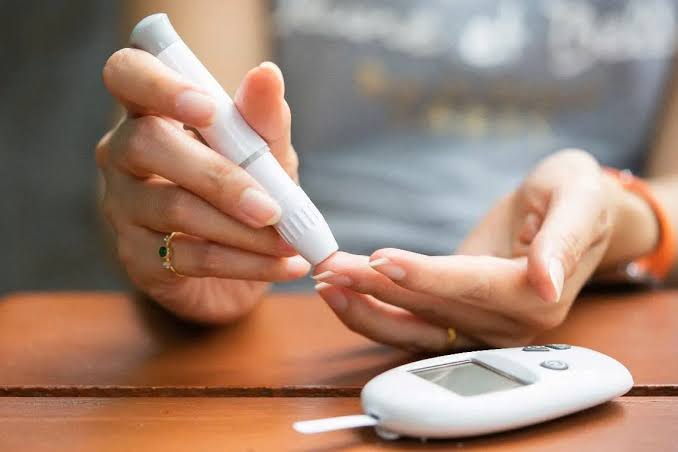
What to Record — The Essential Log Fields
Date, Time, and Testing Context
The minimum information for any glucose log entry is the date, the exact time of measurement, and the testing context — specifically, whether the measurement was taken fasting (before the first meal of the day, at least 8 hours after the last meal or food intake), pre-meal (just before eating), post-meal (typically 1–2 hours after the start of eating), at bedtime, during the night, or in response to symptoms. The testing context is essential for interpreting the glucose value: a fasting glucose of 145 mg/dL is concerning; a post-meal glucose of 145 mg/dL one hour after a meal containing 60 grams of carbohydrate is often acceptable. Recording the context along with the number allows meaningful comparison — fasting values compared to other fasting values, post-meal values compared to other post-meal values — rather than comparing measurements taken at different points in the glucose curve as if they were equivalent. For adults testing multiple times daily, a simple shorthand for context (F = fasting, PM = pre-meal, 2hr = 2 hours post-meal, BT = bedtime) reduces recording time while preserving the information needed for pattern analysis.
Medication and Insulin Information
For adults on insulin, logging each dose alongside glucose readings is essential for identifying whether the insulin regimen is producing the intended effect. The log entry for an insulin dose should include: the type of insulin (basal versus rapid-acting), the units administered, and the exact time. Paired with glucose readings before and after each dose, this insulin log creates the basis for evaluating whether the current dose is appropriate. For adults on oral medications or non-insulin injectables, noting any missed doses or timing variations alongside the glucose readings creates the data for assessing adherence — and confirming whether glucose fluctuations correlate with medication timing. For adults on no glucose-lowering medications who are monitoring through dietary and lifestyle management, the medication field may document supplements, including any glucose-lowering supplements like berberine or fiber, so their effect can be assessed against the glucose record.
Meal Information — The Most Impactful Context for Post-Meal Readings
Meal notes in a blood sugar log can range from a simple carbohydrate gram estimate to a full description of what was eaten. The level of detail required depends on the management goal. For adults trying to understand which specific foods drive post-meal glucose spikes, a detailed meal description — “rice bowl with chicken and vegetables, approximately 60g carbohydrate” — paired with the 2-hour post-meal glucose creates a food-glucose database over time. For adults primarily interested in whether total daily glucose control is adequate, a simpler notation — “lunch, moderate carb” — may be sufficient. The most clinically useful meal information includes an estimate of carbohydrate content in grams — even a rough estimate — because carbohydrate intake is the primary dietary driver of post-meal glucose elevation. Portion size context (small, medium, large) is more useful than food type alone, because a large portion of a low-glycemic food can produce a larger glucose response than a small portion of a moderate-glycemic food. Our blood sugar log and tracking guide covers the systematic monitoring approach that structures how log data is collected and reviewed over time. The diabetes apps guide covering digital alternatives to paper logging — including apps that combine glucose logging with food databases and CGM integration — is in our diabetes apps guide.
Paper Versus Digital Logs — Practical Comparison
When Paper Templates Work Better
Paper blood sugar log templates have advantages that digital formats do not. They require no battery, no app, no account, and no internet connection — making them reliable in all environments including travel, power outages, and medical facilities where phones may need to be stored. They are easily shared with any care team member without technology compatibility concerns — a printed log page is universally readable. They require no setup, no learning curve, and no privacy concerns about health data handling by third-party apps. For adults who find phone-based logging interrupts their daily rhythm — particularly older adults who are not habitual smartphone users — a pocket-sized paper log or a clipboard-sized weekly template in the kitchen captures data with less friction than opening an app. Standardized paper templates — with pre-printed columns for date, time, glucose reading, meal notes, and medication — reduce the cognitive effort of deciding what to record and produce consistently structured records that are easy to review. Several diabetes organizations including the ADA provide printable log templates; most endocrinology clinics provide their own standardized forms at diagnosis or education visits.
When Digital Logging Is More Practical
Digital diabetes apps offer automatic data entry through Bluetooth meter pairing and CGM integration — eliminating the manual transcription step that most commonly leads to incomplete paper records. For adults who test multiple times daily, typing or writing each reading into a separate log creates enough additional effort that many skip entries, producing gaps that reduce the log’s analytical value. When the glucose meter or CGM automatically syncs readings to an app, the logging burden drops to adding contextual notes — meal content, medication, unusual circumstances — rather than transcribing the glucose value itself. Digital logs also allow automatic calculation of averages, time-of-day patterns, and estimated A1c — analysis that would require spreadsheet work to replicate from paper records. The pattern visualization available in digital apps — seeing a week of glucose readings as a color-coded time-of-day graph rather than a column of numbers — makes patterns visible that are difficult to extract from a table of entries. Our continuous glucose monitors guide covers CGM technology that automates the glucose capture portion of logging entirely. The best blood glucose monitors guide covering Bluetooth meters that sync automatically with logging apps — reducing manual data entry to near zero for fingerstick testing — is in our best blood glucose monitors guide. The doctor visit checklist covering how to prepare and share log data most effectively at diabetes care appointments is in our doctor visit checklist for diabetes guide. The medication list template for diabetes care — the companion document that pairs with a glucose log to provide a complete self-management picture for care team visits — is in our medication list template for diabetes care guide. The annual care checklist that includes glucose log review as preparation for the comprehensive annual diabetes management assessment is in our annual diabetes care checklist. The questions to ask about Type 2 diabetes guide — including what information the care team most needs from a glucose log to make productive management recommendations — is in our questions to ask about Type 2 diabetes guide. The long-term diabetes care plan covering how glucose log data accumulated over months and years supports the multi-year management goals and trend assessment in comprehensive diabetes care is in our long-term diabetes care plan guide. The building healthy habits guide covering how glucose log data guides the specific behavioral changes — meal composition, activity timing, sleep patterns — that improve blood sugar outcomes over time is in our building healthy habits with diabetes guide. The ADA’s blood sugar monitoring guidance covers target glucose ranges and monitoring frequency recommendations that determine what a blood sugar log should be measuring and how often. The NIDDK’s blood glucose monitoring overview covers how self-monitoring records fit within the comprehensive diabetes self-management approach recommended for adults with Type 1 and Type 2 diabetes. The CDC’s blood glucose monitoring guide provides accessible practical guidance on what blood sugar records to keep and how to use them.
Activity and Symptom Fields — Often Omitted, Often Important
Physical Activity — Its Effect on Glucose Is Both Immediate and Delayed
Physical activity is one of the most powerful non-pharmacological influences on blood glucose, and its effect operates on two timescales that are important to capture in a log. During and immediately after moderate aerobic exercise — a 30-minute brisk walk, swimming, cycling — glucose typically falls, because exercising muscle uses glucose as fuel independently of insulin. This acute fall means that adults on insulin or sulfonylureas who exercise without adjusting medication timing or carbohydrate intake may experience hypoglycemia during or within the hour after exercise. Recording exercise type, duration, and timing in the blood sugar log — alongside the pre- and post-exercise glucose readings — creates the data to identify how much glucose an individual’s body drops per exercise session, which informs medication timing decisions for subsequent exercise events. The delayed effect is less intuitive: moderate to vigorous exercise increases insulin sensitivity for 12–24 hours after the session, meaning that the same meal that produces a high post-meal glucose on a sedentary day may produce a much lower reading the day after a significant exercise session. Adults who do not record exercise in their glucose log often cannot explain why glucose levels that seemed consistent become variable — the variable they are missing is the prior day’s activity. For adults with prediabetes using lifestyle modification as the primary intervention, correlating exercise records with fasting glucose trends over weeks reveals whether the exercise program is producing the expected improvement in insulin sensitivity. Our questions to ask about prediabetes guide covers how lifestyle monitoring data — including exercise and glucose logs — supports the care conversations most relevant to prediabetes management.
Symptom Logging — Connecting Glucose Values to How You Feel
Glucose numbers document what the meter reads, but they do not automatically capture whether the person noticed anything at that glucose level — which is clinically relevant information. Hypoglycemia symptoms — shakiness, sweating, palpitations, confusion, blurred vision — typically begin for most adults when glucose falls below 70 mg/dL, but the threshold at which symptoms appear varies substantially between individuals, particularly in adults with long-standing diabetes who may have impaired hypoglycemia awareness. Recording symptoms alongside glucose values — “slightly shaky at 74 mg/dL, resolved after juice” — over multiple episodes creates the data to identify an individual’s personal symptomatic threshold. This is especially important for adults whose care team is concerned about hypoglycemia unawareness — the loss of early warning symptoms that occurs when hypoglycemia episodes are frequent and the body’s counter-regulatory response is blunted. High glucose symptoms — excessive thirst, frequent urination, fatigue, blurred vision — recorded alongside corresponding glucose values create a correlation record that may help identify a personal symptomatic threshold for hyperglycemia, which is useful for both self-management and care team communication. A log entry that reads “glucose 275 mg/dL, extremely fatigued, thirsty, headache” is more actionable clinical information than “275” alone.
How to Review Log Data — Making the Information Useful
Weekly Pattern Review — The Core Analytical Practice
Recording blood sugar readings without reviewing them produces data but not insight. The practice that turns a glucose log from a record into a management tool is weekly pattern review — setting aside 10–15 minutes at the end of each week to look at the week’s entries not as individual readings but as a pattern. The key questions for weekly review are: Which testing times consistently show readings outside the target range? Is the pattern consistent across all days of the week, or only certain days? When out-of-range readings appear, what meal, activity, medication, or circumstance occurred before them? Are fasting readings trending up, down, or stable compared to the prior week? Are post-meal peaks after certain types of meals consistently higher than others? A glucose log that reveals a pattern — “fasting readings are consistently in the 130–150 range,” or “post-dinner readings Tuesday through Friday are consistently above 180 when dinner includes rice” — gives the care team a specific, addressable finding rather than a vague report of “my numbers are running high sometimes.” Adults who bring a week of reviewed, annotated log data to a care visit — with the patterns they have identified marked and questions prepared — have more productive appointments than those who bring an unreviewed log and leave the pattern extraction to the 15 minutes of appointment time. The doctor visit checklist covers how to structure log data review as part of comprehensive appointment preparation — not only identifying patterns but formulating the specific questions those patterns raise. The questions to ask about Type 2 diabetes guide covers what the care team most needs from a log review to make specific management recommendations. Our questions to ask about Type 2 diabetes guide includes the specific questions that log-identified patterns most productively generate at care team visits.
Monthly and Quarterly Trend Review
Weekly review identifies what is happening in a given week; monthly and quarterly review identifies whether glucose management is improving over time. Monthly trend review compares average fasting glucose across four weeks, notes whether the frequency of out-of-range readings is increasing or decreasing, and identifies whether any seasonal or schedule changes — a new job, a change in activity, a dietary change — correlate with shifts in glucose patterns. Quarterly review — aligned with HbA1c testing intervals — compares the log-estimated average glucose with the laboratory HbA1c, identifies the management changes made during the quarter, and assesses whether those changes produced the expected improvement. The comparison between the log’s estimated average glucose and the laboratory HbA1c is instructive: in most adults, the two measures align reasonably well (with HbA1c conversion approximately: HbA1c 7% ≈ average glucose 154 mg/dL, HbA1c 8% ≈ 183 mg/dL). A significant discrepancy — high estimated average glucose but lower-than-expected HbA1c, or vice versa — may indicate selective testing (testing primarily when glucose is expected to be good), conditions that affect HbA1c reliability, or high glucose variability that is not captured by the average. The long-term diabetes care plan guide covers how quarterly data review fits within the multi-year monitoring and goal-adjustment framework that structures comprehensive diabetes management over time. Our long-term diabetes care plan guide provides the framework for using accumulated log data in multi-year management planning.
Logging for Prediabetes — A Different Purpose and Approach
Adults with prediabetes who are monitoring glucose — either with periodic fingerstick checks approved by their clinician, or through a short-term CGM wear to understand their glucose patterns — use blood sugar logs differently from adults with established diabetes. The primary goal of glucose logging in prediabetes is to identify whether lifestyle interventions — dietary changes, increased physical activity, weight management — are producing measurable improvement in fasting and post-meal glucose readings over time. Rather than multiple daily readings, prediabetes monitoring typically involves fasting readings several mornings per week, occasional post-meal checks to understand how specific meal compositions affect glucose, and periodic comparison of the log averages to track the trajectory of prediabetes management. A log that shows fasting glucose falling from a consistent 112–118 mg/dL at baseline to 103–108 mg/dL after three months of dietary and activity changes provides objective evidence that the lifestyle intervention is working — reinforcing adherence motivation and providing the care team with data to assess whether medication initiation is indicated. The questions to ask about prediabetes guide covers what information care teams most need from a monitoring log to guide prediabetes management decisions — including when evidence from the log suggests lifestyle intervention is insufficient and medication discussion should be initiated. The living well with diabetes guide — which covers the sustainable self-management approach that integrates monitoring into daily life without making it the central preoccupation — addresses how to maintain a useful glucose log as one component of a manageable routine rather than as a source of anxiety. Our living well with diabetes guide provides the practical framework for integrating log-keeping into sustainable daily routines.
Starting and Sustaining a Logging Habit — Practical Recommendations
The most common reason blood sugar logs fail to produce useful information is inconsistency — partial records that cover only some testing times on some days, leaving too many gaps for meaningful pattern analysis. The most effective approach to building a consistent logging habit is to start smaller than feels ambitious: commit to logging one specific testing time — fasting only, or post-dinner only — every day for two weeks before adding additional testing times. A complete record of one testing time per day is more analytically useful than an incomplete record of six testing times with frequent gaps. Once daily fasting logging is consistent, adding one post-meal testing time — whichever meal is most variable or most concerning based on initial data — expands the record incrementally without requiring a large initial time commitment. For adults who use a paper log, keeping the log in the same location as the glucose meter — so picking up the meter and completing the log entry happen as one action — reduces the effort of remembering to record after testing. For adults using a digital app, setting a brief reminder to add meal notes immediately after eating — before the meal composition is forgotten — captures the contextual information that makes glucose readings interpretable. The supplement safety guide — covering how to evaluate and document any supplements being used alongside diabetes medications — addresses how supplement use is documented within the same self-management record system that includes the glucose log. Our supplement safety for people with diabetes guide covers how supplements are evaluated and monitored alongside standard diabetes care. The fiber supplements and blood sugar guide covering how specific supplement interventions affect the glucose readings that appear in a log is in our fiber supplements and blood sugar guide.
Sources: ADA Standards of Care in Diabetes 2024 — Self-monitoring of blood glucose section; NIDDK Blood Glucose Monitoring Overview 2024; CDC Blood Glucose Monitoring Guide 2024; Mulvaney SA et al. Self-monitoring blood glucose in type 2 diabetes. Journal of Diabetes Science and Technology 2011; Polonsky WH et al. Structured self-monitoring of blood glucose significantly reduces A1C levels in poorly controlled, noninsulin-treated type 2 diabetes. Diabetes Care 2011.
This is one of the clearest explanations of blood sugar log templates: how to I have found. I appreciate that the article is careful about distinguishing between what is known and what is still being researched. Appreciate the effort that went into researching and writing this — it shows.
As someone dealing with this personally, the blood sugar log templates: how to section was very helpful. The section on managing this condition day-to-day was especially useful for planning. Thank you for making complex medical information accessible without dumbing it down.
As someone dealing with this personally, the blood sugar log templates: how to section was very helpful. The connection between lifestyle choices and long-term outcomes is explained clearly here. Forwarding this to others in my support group who are dealing with similar issues.