
Continuous Glucose Monitoring: A Beginner’s Guide
Continuous glucose monitoring (CGM) is a technology that has fundamentally changed what is possible in diabetes management — replacing the isolated snapshots of fingerstick testing with a continuous real-time stream of glucose data that captures what is happening between scheduled test times. If a traditional glucose meter is a single photograph of blood sugar at one moment, a CGM is a video — showing the full glucose curve across the day and night, including the rises after meals, the overnight dips, the early morning increases, and the responses to exercise, stress, and illness that a meter user checking four times per day would otherwise miss entirely. For anyone managing diabetes or wanting to understand their glucose metabolism in depth, understanding how CGM works, what it measures, and how to read the data it generates is increasingly important as the technology becomes more accessible and widely used. For the foundational context of blood glucose monitoring more broadly, see our guide on home blood sugar monitoring, and for a comparison of CGM with traditional fingerstick testing and other glucose measurement approaches, see our guide on how often blood sugar should be checked.
How Continuous Glucose Monitoring Works
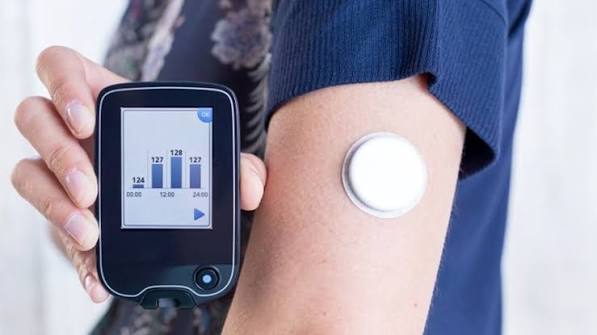
A CGM system consists of three components: a small sensor inserted just under the skin, a transmitter that processes the sensor signal and sends it wirelessly, and a receiver (which may be a dedicated device or a smartphone app) that displays the glucose readings in real time. Some systems combine the sensor and transmitter into a single unit; others have them as separate components.
The sensor and its measurement principle: The CGM sensor is a tiny filament — typically 5–9 millimeters long and less than 0.5 millimeters in diameter — that is inserted into the subcutaneous tissue (just below the skin) of the abdomen, upper arm, or back of the upper arm, depending on the device. The sensor tip sits in the interstitial fluid — the fluid that surrounds cells in the tissue — and contains an enzyme (typically glucose oxidase) that reacts with glucose molecules in the interstitial fluid to generate a small electrical current proportional to the glucose concentration. The transmitter converts this electrical signal into a glucose reading, typically expressed in mg/dL, and sends it to the display device via Bluetooth or radio frequency every one to five minutes. The sensor is worn continuously for the duration of its approved wear period — currently seven to fifteen days depending on the device — after which it is removed and a new sensor is inserted.
Interstitial glucose vs. blood glucose: A critical distinction that all CGM users need to understand is that CGM measures interstitial glucose — the glucose in the fluid surrounding cells — rather than blood glucose directly. Interstitial glucose closely tracks blood glucose during stable conditions, but there is a physiological lag of approximately five to fifteen minutes during periods of rapidly changing glucose. When blood glucose is rising quickly after a meal, the CGM reading may be 10–20 mg/dL lower than the actual blood glucose; when blood glucose is falling quickly (during exercise or after an insulin dose), the CGM may show a reading that is still in range while blood glucose has already fallen below the hypoglycemia threshold. This lag is why CGM devices include trend arrows — indicating whether glucose is stable, rising slowly, rising rapidly, falling slowly, or falling rapidly — which provide additional information beyond just the current reading. For decisions during periods of rapid glucose change (treating hypoglycemia, calculating a correction insulin dose after a meal), fingerstick confirmation is recommended by most clinical guidelines, because the CGM lag can produce a meaningfully different value from actual blood glucose at those moments. Understanding how the body controls blood sugar — the physiological mechanisms that drive glucose changes throughout the day — provides important context for understanding why glucose changes at different rates in different situations and why the CGM lag matters more in some contexts than others.
The Major CGM Systems Available
Several CGM systems are available in the United States and globally, with different sensor wear durations, accuracy characteristics, calibration requirements, and display options. The technology is evolving rapidly; the following represents major systems as of 2024–2025.
Dexcom G7: A sensor and transmitter combined in one unit, worn on the upper arm or abdomen, with a ten-day wear duration. Factory calibrated — no fingerstick calibration required. Integrates with most major insulin pumps and diabetes management apps. Compatible with both Android and iOS smartphones and a dedicated receiver. One of the most widely prescribed and studied CGM systems for insulin-requiring diabetes.
Abbott FreeStyle Libre 3: Worn on the upper arm, fourteen-day wear, factory calibrated. Available in a scanning version (the reader or phone must be waved over the sensor to get a reading) and a streaming version (FreeStyle Libre 3) that continuously transmits to a smartphone with alerts. The streaming version behaves similarly to real-time CGM; the scanning version is technically “flash glucose monitoring” but provides detailed retrospective glucose graphs. The FreeStyle Libre series has been particularly impactful in expanding CGM access due to lower cost than some alternatives.
Medtronic Guardian 4: Integrated with Medtronic insulin pumps in closed-loop systems. Factory calibrated on the newest generation. Sensor worn on the abdomen. Fifteen-day wear. Provides glucose data to the MiniMed 780G pump system that uses the glucose readings to automatically adjust insulin delivery throughout the day and night — a fully automated insulin delivery (AID) approach. For people with Type 1 diabetes using Medtronic insulin pumps, this integration provides the most automated insulin management currently available.
- Data density: CGM = ~288 readings/day | Fingerstick = 4–10 readings/day
- What it misses: CGM = nothing (continuous) | Fingerstick = everything between tests
- Trend information: CGM = yes (trend arrows) | Fingerstick = no
- Alerts for lows/highs: CGM = yes (alarms) | Fingerstick = none
- Pain per day: CGM = one insertion every 7–15 days | Fingerstick = 4–10 per day
- Accuracy limitation: CGM = 5–15 min lag during rapid changes | Fingerstick = ±15% at any time
- Cost: CGM = higher upfront, covered by insurance for most insulin users | Fingerstick = lower per-reading cost
- Time-in-range data: CGM = yes | Fingerstick = no
Reading and Understanding CGM Data
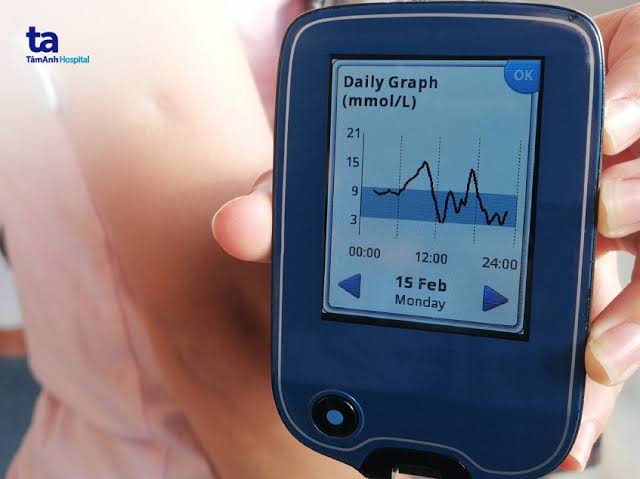
The value of CGM comes from understanding what the data means — not just reading the current number but interpreting the trend arrows, recognizing patterns, and responding appropriately to alerts. For beginners, the volume of data CGM produces can initially feel overwhelming; developing a structured approach to reading the data makes it actionable rather than just voluminous.
Current reading and trend arrows: The current CGM reading should always be interpreted together with the trend arrow. A reading of 110 mg/dL with a stable arrow (glucose has been flat for the past 15–30 minutes) means something very different from 110 mg/dL with a double-down arrow (glucose is falling more than 3 mg/dL per minute). In the first case, 110 mg/dL is a comfortable in-range value requiring no action. In the second case, 110 mg/dL with a rapidly falling trend means glucose will likely be in the hypoglycemia range within 15–20 minutes if nothing is done. The trend arrow effectively adds a velocity component to the current position reading — both pieces of information are needed to take appropriate action. Most CGM systems display arrows indicating: rapidly rising (above 3 mg/dL/min), slowly rising (1–3 mg/dL/min), stable (less than 1 mg/dL/min change), slowly falling, and rapidly falling. Combining the current value with the trend arrow is the primary skill in real-time CGM interpretation.
Alerts and alarms: CGM devices can be set to alert when glucose reaches specific high or low thresholds, when glucose is predicted to reach a threshold within a defined time (predictive alerts), and when glucose is changing rapidly. Low alerts (typically set at 70–80 mg/dL) provide advance warning before hypoglycemia becomes symptomatic. Urgent low alerts (typically 55 mg/dL, cannot be silenced on most devices) indicate severe hypoglycemia requiring immediate treatment. High alerts notify of hyperglycemia that exceeds the set threshold. Setting alert thresholds requires balancing sensitivity (catching actual problems) against specificity (avoiding excessive false alarms that lead to alert fatigue and alarm silencing). Most diabetes care providers help new CGM users set initial alert thresholds and adjust them based on experience. For the clinical context on when blood sugar symptoms require medical attention — knowledge that complements understanding CGM alerts — see our guide on when blood sugar symptoms need medical attention.
Time-in-range and ambulatory glucose profile: CGM generates a daily report called the Ambulatory Glucose Profile (AGP), which overlays multiple days of glucose data onto a single 24-hour graph, showing the typical glucose pattern, the range of variability, and the percentage of time spent in different glucose ranges. The key metric from this report is time-in-range — the percentage of CGM readings within the target range (typically 70–180 mg/dL for most people with diabetes, or 70–140 mg/dL for more aggressive targets in some populations). Major diabetes guidelines now recommend time-in-range as a clinical target alongside A1C: a minimum of 70% time-in-range (corresponding to approximately an A1C of 7%) is a typical starting target, with higher percentages representing better control. The AGP also shows time-below-range (hypoglycemia — target less than 4% below 70 mg/dL) and time-above-range (hyperglycemia — target less than 25% above 180 mg/dL). Reviewing the AGP monthly or at each clinical appointment provides a comprehensive picture of glucose management quality that a list of A1C values alone cannot offer. For context on how CGM time-in-range data relates to the A1C average that clinical laboratory testing provides, our guide on the A1C test and our guide on A1C vs blood glucose: what is the difference explain the relationship between these different glucose measurement approaches and how they complement each other in a comprehensive monitoring plan. And for the full reference ranges that help put both CGM data and traditional glucose values in clinical context, our blood sugar chart for adults provides the standard diagnostic and management thresholds across all major testing modalities — making CGM data interpretable against the same clinical benchmarks used for all other glucose measurement approaches. The foundational understanding of what blood sugar is and why it matters, combined with the real-time continuous picture that CGM provides, gives the most complete foundation for understanding and managing glucose metabolism available to people with diabetes today. For anyone considering CGM who wants to understand how it fits into a broader monitoring strategy that includes both the moment-to-moment data of CGM and the long-term average of A1C, our guide on how often blood sugar should be checked provides practical guidance on integrating CGM into a comprehensive monitoring plan tailored to individual clinical needs.
Who Benefits Most From CGM
While CGM provides richer glucose data than fingerstick testing for anyone who uses it, the clinical benefit — in terms of improved A1C, reduced hypoglycemia, and better quality of life — is best established in specific populations where the continuous data most directly enables better management decisions.
Type 1 diabetes: The evidence for CGM benefit is strongest and most consistent in Type 1 diabetes. Multiple randomized trials — including the landmark DIAMOND trial and the GOLD trial — have demonstrated that CGM use in Type 1 diabetes reduces A1C by 0.3–0.6 percentage points compared to fingerstick testing, reduces time in hypoglycemia by 30–40%, and reduces hypoglycemia fear and diabetes distress. These benefits are greatest when CGM is worn consistently (the trials show that benefit tracks closely with how often the CGM data is reviewed and acted upon) and are sustained over time in observational studies of CGM use in real-world clinical practice. For Type 1 diabetes, CGM is now considered the standard of care by the American Diabetes Association, the Endocrine Society, and equivalent bodies in Europe and elsewhere — with fingerstick testing as an adjunct for confirming CGM readings in specific situations rather than as the primary monitoring method. Our guides on the symptoms of Type 1 diabetes and what diabetes is provide the foundational clinical context for understanding why continuous glucose data matters so much in managing this condition.
Type 2 diabetes on insulin: The MOBILE trial, published in 2021, demonstrated that CGM use in adults with Type 2 diabetes treated with basal insulin in a primary care setting reduced A1C by 1.1 percentage points compared to fingerstick testing over eight months — a clinically substantial improvement, larger than seen in many Type 1 trials. This finding reflected the particularly high baseline A1C in the study population (average 9.1%) and the large benefit of CGM in enabling both patients and providers to see glucose patterns they were previously managing blind. For insulin-treated Type 2 diabetes, CGM is now recognized as providing clinically meaningful benefit and is increasingly covered by insurance for this indication.
Type 2 diabetes not on insulin: The benefit of CGM in non-insulin-treated Type 2 diabetes is more modest in terms of A1C reduction (typically 0.3–0.5 percentage points in clinical trials) but may be substantial in terms of behavior change. CGM in this group primarily works by making the impact of specific foods, meal timing, and physical activity immediately visible — a piece of pizza that causes glucose to spike to 220 mg/dL an hour later is a more persuasive motivator for dietary change than an abstract discussion of carbohydrate content. Short-term CGM wear (two to four weeks of sensor use to gather behavioral data, rather than continuous indefinite CGM) has been studied as a strategy for this group, providing a learning period that identifies individual glucose responses to common foods and activities without requiring permanent CGM use. For context on the broader role of glucose monitoring in Type 2 diabetes management on oral medications, our guide on how often blood sugar should be checked provides the evidence-based framework for matching monitoring intensity to individual clinical need.
Pregnancy and gestational diabetes: The CONCEPTT trial demonstrated that continuous glucose monitoring during pregnancy in women with Type 1 diabetes reduced rates of large-for-gestational-age infants, neonatal intensive care admissions, and neonatal hypoglycemia — outcomes that translate to meaningful reductions in delivery complications and neonatal health problems. CGM in gestational diabetes is also being studied and used increasingly, as the stringent glucose targets for pregnancy management benefit from the continuous data that allows more precise adjustment than fingerstick testing alone. For context on blood glucose testing in pregnancy, see our guide on the oral glucose tolerance test, which covers the standard diagnostic approach for gestational diabetes that typically precedes CGM use during pregnancy.
Getting Started With CGM: Practical Steps
For anyone starting CGM for the first time, the initial setup and learning period involves several practical steps that are distinct from simply operating a fingerstick meter. The following covers the most important aspects of starting CGM successfully.
Obtaining a prescription and CGM system: CGM requires a prescription from a healthcare provider. Coverage criteria vary by insurer — Medicare covers CGM for people with diabetes who require frequent insulin dose adjustments; most commercial insurance plans cover CGM for insulin-using patients and, increasingly, for non-insulin users as well. The prescribing provider will select a CGM system based on clinical needs, existing equipment (insulin pump compatibility), patient preference, and insurance coverage. A diabetes educator or certified diabetes care and education specialist (CDCES) is often invaluable at this stage — these specialists can demonstrate sensor insertion, help set initial alert thresholds, and teach CGM data interpretation in the context of individual management goals.
Sensor insertion and warm-up: Each CGM system includes an applicator device that inserts the sensor with a spring-loaded mechanism — sensor insertion is typically less painful than a lancet stick, though some people experience a brief stinging sensation. Most sensors require a warm-up period of one to two hours after insertion before readings begin, during which the sensor tip equilibrates with the interstitial fluid. First-day readings may be slightly less accurate than subsequent days as the tissue around the insertion site settles; most studies show accuracy improves over the first twenty-four hours of each sensor session. The insertion site should be rotated between sensors — always inserting in the same spot can cause local tissue changes that reduce accuracy and sensor longevity.
Calibration: Factory-calibrated systems (Dexcom G7, FreeStyle Libre 3) do not require routine fingerstick calibration — the calibration is built into the manufacturing process for each sensor lot. However, calibration fingerstick checks may be recommended in specific situations: when the sensor reading seems inconsistent with symptoms, when alerts are not consistent with expectations, or after a sudden jarring of the sensor. Some systems (Medtronic Guardian 4 in certain modes) may still recommend periodic fingerstick calibration for optimal accuracy. Always follow the specific calibration guidance for the CGM system being used, as incorrect calibration can actually degrade accuracy rather than improve it.
Integrating CGM into daily life: Most sensors are approved as water-resistant for showering and swimming within defined depth and duration limits, though submerging for extended periods or at depth (swimming laps, scuba diving) may affect the adhesive or transmitter. Most sensors use adhesive patches to secure the sensor to the skin; people with adhesive sensitivity may need to use adhesive barrier products or find a more compatible sensor location. Physical activity, especially contact sports, can dislodge sensors if protective covers are not used. Over time, most CGM users develop a routine of checking their phone or receiver periodically throughout the day — before meals, before and after exercise, at bedtime, and when alerts sound — that integrates naturally into daily life with much less burden than equivalent information obtained from multiple daily fingerstick tests. For anyone who has recently started CGM and wants to understand what the glucose patterns showing on their device mean in clinical terms — whether the morning rise is normal, whether the post-meal spike is concerning, whether the overnight glucose is behaving as expected — our guides on morning blood sugar: what it means, post-meal blood sugar explained, and fasting blood sugar explained provide the clinical reference framework for interpreting what the CGM graph is showing at each key time of day. And for the broader context of why tracking blood sugar so closely over time matters for long-term health, our guide on why blood sugar matters for long-term health explains the evidence on how glucose control reduces the risk of diabetes complications — connecting the daily effort of monitoring to the long-term outcomes that effort is protecting. The combination of real-time continuous glucose data from CGM and periodic A1C measurement from clinical laboratory testing provides the most complete picture currently available of both moment-to-moment glucose management and long-term glycemic burden — giving people with diabetes and their healthcare teams the richest possible information base for optimizing management and protecting long-term health.
Sources: American Diabetes Association. Standards of Medical Care in Diabetes — 2024. Diabetes Care. 2024;47(Suppl 1):S20–S42. • Battelino T, et al. Clinical Targets for Continuous Glucose Monitoring Data Interpretation. Diabetes Care. 2019;42(8):1593–1603. • Dexcom Inc. Dexcom G7 Continuous Glucose Monitoring System. Dexcom; 2024.
Came across this while researching continuous glucose monitoring: a beginner’s guide for a family member. The practical tips made this immediately actionable, not just theoretical. Appreciate the effort that went into researching and writing this — it shows.
Bookmarked this article on continuous glucose monitoring: a beginner’s guide immediately — going to reference it regularly. I have tried following advice from several sources but this is most consistent with what my specialist told me. This is exactly why I prefer this website over generic health platforms.
This breakdown of continuous glucose monitoring: a beginner’s guide is exactly what patients need before a specialist appointment. The connection between lifestyle choices and long-term outcomes is explained clearly here. This is going into my health folder that I bring to every doctor’s visit.