
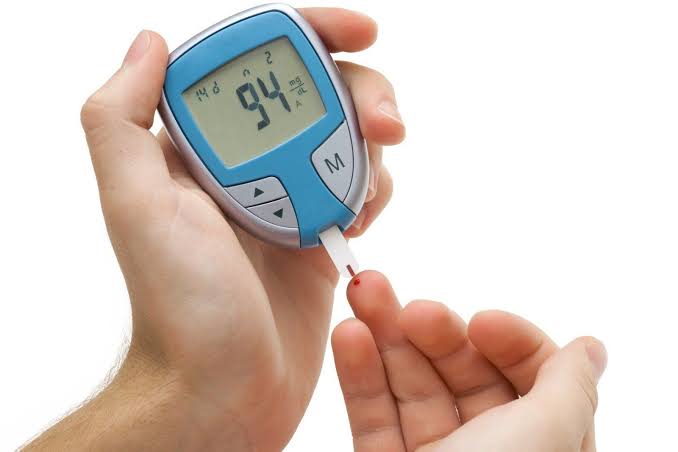
Blood Sugar Log: How to Track Your Numbers
A blood sugar log is the tool that transforms individual glucose readings from isolated data points into meaningful patterns. A glucose meter reading of 178 mg/dL tells you your blood sugar is above the post-meal target right now. A week of blood sugar log entries showing post-dinner readings consistently in the 170–200 mg/dL range tells you that dinner management needs attention — regardless of what other readings throughout the day look like. That shift from isolated readings to patterns is what drives better management decisions, more productive clinical conversations, and ultimately better glucose control over time. This guide covers everything needed to build and maintain an effective blood sugar log: what information to record, how to structure the log, which format (paper vs. app) best fits different needs, how to identify patterns in the data, and how to present the data to a healthcare provider. For the reference ranges that help interpret log entries, see our blood sugar chart for adults. For the technical foundation of how to test accurately, see our guide on how to use a glucose meter.
What to Record in a Blood Sugar Log
The value of a blood sugar log depends entirely on what is recorded alongside the glucose reading. A list of numbers without context — 145, 198, 87, 162 — is nearly uninterpretable. The same numbers annotated with time of testing, timing relative to meals, meal content, and relevant contextual factors become a diagnostic tool. The following are the elements that should be recorded with each entry, in order of importance.
Date and time: The exact time of the reading is essential for placing it in the context of the day’s glucose pattern. A reading of 145 mg/dL at 7 AM (fasting) means something very different from the same reading at 11 AM (two hours after breakfast) or 3 PM (afternoon, hours after lunch). Without the time, the reading cannot be assigned to the correct phase of the glucose pattern. Recording both date and time also allows week-to-week comparison — whether Monday morning fasting glucose is consistently higher or lower than Wednesday morning, for instance — and allows correlation with day-of-week patterns in eating, activity, or stress. Our guide on fasting blood sugar explained covers what the morning fasting time point specifically reveals and what it should be compared against.
Meal timing label: Label each reading with its timing relative to the last meal: “fasting,” “pre-breakfast,” “1 hour after breakfast,” “2 hours after lunch,” “before dinner,” “2 hours after dinner,” “bedtime,” etc. This label is what makes the reading interpretable against the correct clinical reference range. Without it, even an accurate glucose value cannot be reliably interpreted. Our guides on post-meal blood sugar explained and morning blood sugar: what it means provide the clinical context for interpreting readings at these key time points.
Meal content (brief): A brief note on what was eaten at the most recent meal — not a detailed food diary, but enough to identify obvious patterns. “Large pasta portion,” “skipped breakfast,” “high-carb snack,” or “salad with protein” gives enough context to identify food-glucose correlations. Over time, these notes reveal which specific foods or meal patterns drive the highest post-meal spikes for that individual — information that is not apparent without the meal context alongside the glucose readings.
Insulin dose (if applicable): For insulin users, recording the type, dose, and time of each insulin injection alongside glucose readings is essential for understanding why glucose changed as it did between readings. A fasting glucose of 155 mg/dL is interpreted very differently if the previous day’s basal insulin dose was missed versus taken on schedule. A post-meal glucose of 220 mg/dL means something different if no bolus was taken for that meal versus a full bolus dose. The insulin log transforms the glucose log from a passive recording into an active tool for dose optimization.
Physical activity: Even a brief note about exercise — “30-minute walk after dinner,” “skipped usual workout today,” “high-intensity gym session this morning” — provides critical context for otherwise surprising glucose readings. Exercise reliably lowers glucose during and after activity (for most people; some intense exercise temporarily raises glucose through counter-regulatory hormone release), and the effect can persist for twelve to twenty-four hours with significant activity. Without the activity notation, a glucose reading of 85 mg/dL at bedtime on a day with unusual exercise looks like a worrying low; with the notation, it is an expected exercise response. Our guide on what is insulin resistance explains why exercise has such a consistent and powerful effect on glucose — the physiological context that makes recording activity alongside glucose readings so informative.
Relevant contextual notes: Any other factor that might explain an unusual reading deserves a brief note: “felt stressed before presentation,” “slept poorly last night,” “starting to get a cold,” “ate dinner three hours later than usual,” “forgot medication this morning.” These notes transform mystery readings — the unexplained high at an unexpected time — into understandable data points. Over time, the log reveals individual-specific patterns: that illness consistently raises fasting glucose by a predictable amount, that poor sleep raises morning glucose, that stress spikes glucose in the afternoon, that Friday evenings reliably involve larger meals and higher post-dinner readings. These individual patterns, visible only in a well-annotated log, are what allows management to be precisely tailored to the individual rather than following a generic protocol.
- Date — enables week-to-week comparison and trend tracking
- Time — places reading in the day’s glucose pattern
- Reading (mg/dL) — the glucose value
- Meal timing label — fasting / pre-meal / 1hr post / 2hr post / bedtime
- Brief meal note — what was eaten or whether a meal was skipped
- Insulin dose and timing (if applicable) — type, units, time given
- Activity note — any significant exercise before or after the reading
- Contextual notes — illness, stress, unusual schedule, missed medication
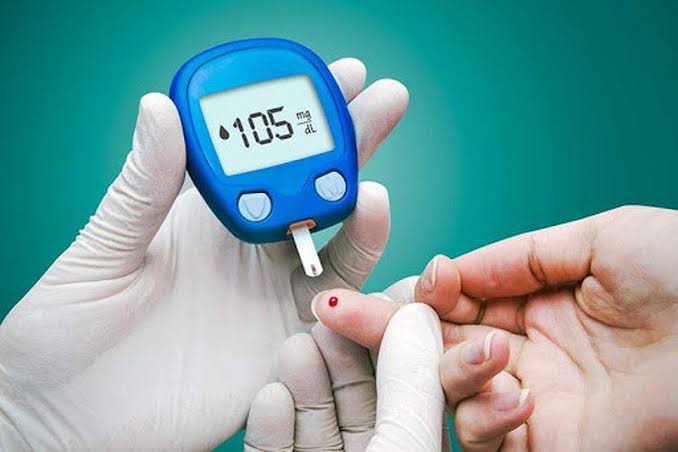
Paper Log vs. Digital App: Choosing the Right Format
Blood sugar logs can be maintained in paper format (a dedicated notebook, a printed log sheet, or a purpose-designed logbook from a diabetes supply company) or digitally (a smartphone app, a spreadsheet, or a program that downloads directly from a glucose meter). Both formats can work well; the best choice depends on the individual’s preferences, technical comfort, and specific needs.
Paper logs: Paper logs have the advantage of being always available (no battery required, no software to update), completely flexible in what is recorded, and tangible in a way that some people find more satisfying and motivating than a phone screen. The disadvantages are that pattern analysis requires manual effort (calculating averages, looking for trends across columns of numbers), reports for healthcare providers must be written or photocopied rather than automatically generated, and the log can be lost, damaged, or left behind. Paper logs work particularly well for people who are comfortable with manual analysis, who prefer handwriting to typing, or who have limited access to smartphones or computers. Many diabetes organizations and pharmaceutical companies offer free printed blood sugar log sheets that include structured columns for the most important fields.
Smartphone apps: Diabetes management apps (mySugr, Glucose Buddy, One Drop, Dario Health, and many others) offer automatic time-stamping, graph visualization of glucose patterns, calculation of averages and estimated A1C, and often the ability to share reports directly with a healthcare provider via email or in-app sharing. Many apps also integrate with specific glucose meters via Bluetooth to import readings automatically, eliminating manual entry and reducing the risk of transcription errors or missed recordings. The disadvantages include reliance on smartphone battery and software, a learning curve for less tech-comfortable users, and the potential for app discontinuation or data loss if the app company changes its service. Most apps offer free basic versions with optional paid premium features; for many users the free version provides sufficient functionality for effective tracking. For anyone using a continuous glucose monitor, the CGM’s companion app already serves the primary tracking function — as covered in our guide on continuous glucose monitoring — and a separate manual log may be needed only for annotations (meal content, activity notes) that the CGM app does not capture automatically.
Meter memory and data downloads: Most glucose meters store the last 250–500 readings in internal memory, with date and time stamps, that can be downloaded to a computer using a USB cable or to a smartphone via Bluetooth. This automatic log is a useful safety net for anyone who forgets to manually record readings; however, it lacks the contextual notes (meal content, activity, symptoms) that are what give the raw numbers clinical meaning. Meter memory data downloads work best as a supplement to manual logging rather than as a replacement for it — or as a way to reconstruct missing data when the manual log has gaps. Our comprehensive guide on home blood sugar monitoring covers the full range of monitoring tools and recording approaches in the context of an integrated monitoring routine. For anyone who is just starting to track glucose systematically for the first time — whether because of a new prediabetes or diabetes diagnosis, a medication change, or simply wanting to understand their metabolic health better — our guide on how often blood sugar should be checked helps establish the right testing frequency and schedule alongside the logging approach, ensuring that the data being collected is comprehensive enough to reveal the patterns that matter most for individual management. And for the foundational context of what blood sugar is, how it changes throughout the day, and what the numbers in a blood sugar log actually reflect about the body’s glucose regulation, our guides on what blood sugar is and how the body controls blood sugar provide the physiological understanding that transforms a blood sugar log from a record-keeping obligation into a genuinely insightful tool for understanding and managing metabolic health.
Identifying Patterns in Your Blood Sugar Log
A blood sugar log is most valuable when reviewed not as a list of individual readings but as a source of repeating patterns. Pattern analysis shifts the question from “what was my blood sugar at that specific moment?” to “what does my blood sugar reliably do at this time of day, after this type of meal, or in this type of situation?” — and it is the patterns rather than the isolated readings that guide management decisions most effectively. The following are the most clinically important patterns to look for when reviewing a blood sugar log.
Consistent high readings at a specific time of day: If fasting glucose is consistently above 130 mg/dL across multiple mornings, overnight glucose regulation is the problem — either basal insulin is insufficient, the dawn phenomenon is active (see our guide on morning blood sugar: what it means for details on this phenomenon), or the evening meal is lasting longer than expected. If post-dinner glucose is consistently the highest reading of the day, dinner composition or size is the primary management focus. If glucose is in target before meals but consistently spikes above 180 mg/dL after eating, the meal carbohydrate load or the timing/dose of pre-meal insulin needs adjustment. Each of these time-specific patterns points to a specific management intervention — and none of these patterns can be identified from an A1C result alone. For context on what target ranges look like at each major time point across the day, our blood sugar chart for adults provides the complete clinical reference framework.
Food-specific patterns: Over time, careful meal annotation reveals which foods or food combinations drive the largest glucose spikes for a specific individual. People vary substantially in their glucose response to the same food — rice causes a larger spike in some people than an equal carbohydrate portion of oats, for others it is the reverse. This individual variability in food-glucose response means that general glycemic index data is only a starting point; personal blood sugar log data — pairing meal descriptions with post-meal glucose readings — reveals which specific foods are the highest priority for management in that individual. This information directly informs practical dietary decisions: not “avoid all carbohydrates” but “my glucose after pasta goes much higher than after the same calorie load from potatoes, so I’ll reduce pasta portions specifically.” Our guide on post-meal blood sugar explained covers the full physiological context of how different foods affect post-meal glucose and how to interpret the post-meal time point in a blood sugar log.
Day-of-week patterns: Many people have systematic differences in glucose patterns between weekdays and weekends — different meal timing, less structured eating, different activity levels, more alcohol on weekends — that a weekly log makes visible but that a single A1C value completely obscures. Identifying that weekend fasting glucose is consistently 15–20 mg/dL higher than weekday fasting glucose, for instance, points directly to the behavioral differences between weekday and weekend patterns that are driving the discrepancy. This kind of day-of-week pattern analysis is only possible when the log has both date information and sufficient duration (at least two to three weeks of data) to reveal the recurring weekly pattern.
Exercise effects: If physical activity is annotated consistently in the log, its effect on glucose becomes visible across multiple exercise days. Some people find that moderate aerobic exercise (a 30-minute walk) reliably lowers blood sugar by 20–40 mg/dL for the next several hours; others find that high-intensity exercise (HIIT, weight training) temporarily raises glucose before the lowering effect appears. These individual exercise responses are visible in a well-annotated log and inform decisions about when to exercise, whether to reduce insulin before exercise, and how to plan snacks around activity to prevent post-exercise hypoglycemia. Without the activity annotations, the glucose effect of exercise is invisible — readings just seem lower or higher without explanation.
Stress and illness patterns: Noting days of high stress, poor sleep, or illness alongside glucose readings reveals the magnitude of these effects in a specific individual. Some people are highly sensitive to acute stress — a difficult work day or significant anxiety can raise glucose by 30–50 mg/dL consistently. Others see minimal glucose impact from emotional stress. Illness almost universally raises glucose through counter-regulatory hormone responses, but the magnitude varies by type and severity of illness. Understanding one’s personal glucose-stress and glucose-illness response allows for proactive management during predictably stressful periods and appropriate interpretation of temporarily elevated readings during illness rather than over-treating them with additional medication that might cause hypoglycemia when the illness resolves and glucose returns to normal.
Using Your Blood Sugar Log at Clinical Appointments
A well-maintained blood sugar log is one of the most valuable tools you can bring to a diabetes care appointment — more informative for guiding management decisions than an A1C value alone, and more actionable than a verbal description of “my numbers have been a little high lately.” The challenge for many patients is that the volume of data in a log can be difficult to summarize quickly in a clinic appointment, and healthcare providers often have limited time to manually review pages of recorded readings. Preparing a useful data summary before the appointment makes the clinical conversation more efficient and productive.
Preparing a pre-appointment summary: Before the appointment, review the log for the past two to four weeks and identify: the typical range of fasting glucose readings (low and high end), any consistent patterns of readings above or below target at specific times of day, the most concerning single readings and what preceded them, and any specific questions about patterns that are puzzling. If using a digital app, generate and print (or electronically share) the app’s standardized report — most apps produce a one- to two-page summary that shows average glucose by time of day, readings over time in a graph, and percentage of readings in and out of target range. This summary takes thirty seconds for a provider to scan and immediately shows the relevant patterns. If using a paper log, bringing the log itself and verbally summarizing the key patterns (“my fasting readings are consistently in the 140s, but my other readings are mostly in target”) allows the provider to verify the pattern against the raw data if desired.
Discussing patterns rather than individual readings: The most productive clinical conversations about glucose data focus on patterns rather than individual readings. An isolated high reading of 250 mg/dL from two weeks ago is less clinically useful than knowing that post-dinner readings are consistently 20–40 mg/dL above target across all days of the log. Framing the data as patterns (“my fasting readings have been running 15–20 mg/dL higher since I started the new medication”) provides the information the provider needs to make a meaningful management recommendation rather than reacting to a single outlier. The provider may also identify patterns in the log that the patient did not notice — a provider reviewing a log with fresh eyes sometimes sees systematic relationships (glucose is lower every Tuesday, which happens to be the patient’s exercise day) that are not obvious from inside the experience of living with the data.
Connecting log data to A1C results: When a clinical A1C result is higher than expected based on the home blood sugar log readings — a very common situation — the blood sugar log provides the investigative starting point. If fasting and pre-meal readings look consistently in range but A1C is elevated, the most likely explanation is post-meal glucose spikes that are not being captured by the testing schedule. The log annotation would suggest checking more frequent post-meal readings to identify whether the post-meal pattern is contributing more to A1C than the current testing schedule reveals. Our guide on A1C vs blood glucose: what is the difference explains this relationship in detail and provides the framework for investigating discrepancies between home log data and A1C results. Consistently using a blood sugar log — even when glucose management is going well — builds the habit and the data foundation that makes it possible to quickly identify the cause when management changes or glucose begins trending in an unexpected direction. The log is not just a record of the past; it is the evidence base for the management decisions of the future, connecting daily monitoring to the long-term glucose control that protects long-term health from the complications of sustained glucose elevation.
Sources: American Diabetes Association. Standards of Medical Care in Diabetes — 2024. Diabetes Care. 2024;47(Suppl 1):S20–S42. • Klonoff DC, et al. Continuous Glucose Monitoring: An Endocrine Society Clinical Practice Guideline. J Clin Endocrinol Metab. 2011;96(10):2968–2979. • Polonsky WH, et al. Structured Self-Monitoring of Blood Glucose Significantly Reduces A1C Levels in Poorly Controlled, Noninsulin-Treated Type 2 Diabetes. Diabetes Care. 2011;34(2):262–267.
This is one of the clearest explanations of blood sugar log: how to track I have found. The article answered questions I didn’t even know I had until I started reading. Thank you for making complex medical information accessible without dumbing it down.
Thank you for covering blood sugar log: how to track so thoroughly without being overly technical. I have tried following advice from several sources but this is most consistent with what my specialist told me. I wish I had found this article earlier — would have saved a lot of confusion.
Came across this while researching blood sugar log: how to track for a family member. I appreciate that the article is careful about distinguishing between what is known and what is still being researched. This gave me real confidence going into my next specialist appointment.