
Lipid Panel Explained: What Each Number Measures
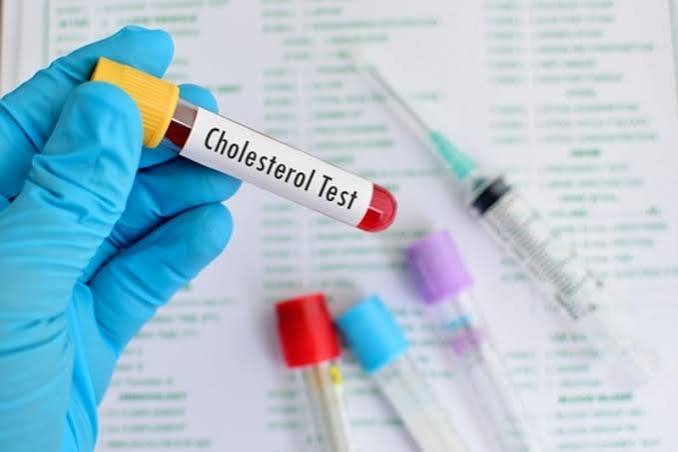
The lipid panel ??? also called a lipid profile or cholesterol panel ??? is the cornerstone blood test of cardiovascular risk assessment and the primary monitoring tool for cholesterol-lowering therapy. It measures the concentrations of cholesterol and triglycerides within different lipoprotein particles in the blood, providing the four numbers that guide decisions about statin therapy, lifestyle intervention, and cardiovascular risk stratification for hundreds of millions of adults worldwide.
Despite being one of the most commonly ordered blood tests in medicine, the lipid panel is frequently misunderstood by patients: many know that “LDL is bad and HDL is good” but do not understand what these lipoproteins actually are, why the numbers matter in context rather than in isolation, or what the relationship between their lipid results and their actual cardiovascular risk looks like. This guide explains what each lipid panel number measures, how to interpret it, and what factors beyond the standard four values provide a more complete picture of atherogenic risk.
LDL Cholesterol ??? The Primary Target of Cardiovascular Prevention
Low-density lipoprotein (LDL) is a lipoprotein particle whose primary function is transporting cholesterol from the liver to peripheral tissues. LDL becomes atherogenic when it penetrates the arterial wall subendothelial space, becomes oxidized, and triggers the inflammatory cascade that initiates and sustains atherosclerotic plaque formation. The central causal role of LDL in atherosclerosis is one of the most robustly established findings in cardiovascular medicine ??? established through epidemiology (Framingham Heart Study and subsequent cohort studies demonstrating continuous positive relationship between LDL-C and cardiovascular events), genetics (Mendelian randomization studies showing that lifetime reduced LDL from genetic variants reduces cardiovascular events proportionally to LDL difference ?? years of exposure), and clinical trials (over 40 large statin randomized controlled trials demonstrating consistent 20 to 25 percent reduction in major cardiovascular events per 38.7 mg/dL LDL-C reduction).
Standard LDL-C is calculated rather than directly measured using the Friedewald equation: LDL-C = Total Cholesterol ??? HDL-C ??? (Triglycerides ?? 5), where all values are in mg/dL. The triglycerides ?? 5 term estimates VLDL cholesterol (the cholesterol content of very low-density lipoprotein particles). This calculation becomes unreliable when fasting triglycerides exceed 400 mg/dL ??? at high TG levels, the TG ?? 5 estimate significantly overestimates VLDL-C and correspondingly underestimates LDL-C. For patients with high triglycerides, direct LDL-C measurement or the more accurate Martin-Hopkins equation (which uses triglyceride-specific VLDL-C estimation factors rather than a fixed ?? 5 divisor) should be used.
LDL-C targets are individualized based on estimated cardiovascular risk:
- Very high risk (established ASCVD ??? prior MI, stroke, peripheral artery disease, or diabetes with additional risk factors): LDL-C below 70 mg/dL, with consideration of below 55 mg/dL in very high-risk patients with recurrent events on optimal therapy (per 2022 ACC Expert Consensus)
- High risk (10-year ASCVD risk ???10%, or LDL-C ???190 mg/dL from familial hypercholesterolemia): LDL-C below 100 mg/dL
- Borderline to intermediate risk (7.5 to 10% 10-year risk): LDL-C below 100 to 130 mg/dL depending on risk-enhancing factors
- Low risk (<7.5% 10-year risk): LDL-C below 130 to 160 mg/dL; statin initiation generally not indicated unless LDL-C ???190 mg/dL
HDL Cholesterol ??? The Protective Lipoprotein (With Important Caveats)
High-density lipoprotein (HDL) particles mediate reverse cholesterol transport ??? the process by which cholesterol is removed from peripheral tissues (including arterial walls) and returned to the liver for excretion. In population epidemiology, higher HDL-C is consistently associated with lower cardiovascular event rates: each 1 mg/dL increase in HDL-C is associated with approximately 2 to 3 percent reduction in coronary heart disease risk in observational studies. Low HDL-C (<40 mg/dL in men, <50 mg/dL in women) is a cardiovascular risk factor included in the ACC/AHA pooled cohort equations risk calculator.
The important caveat about HDL: despite its favorable association in epidemiology, attempts to raise HDL pharmacologically have not reduced cardiovascular events. Niacin (which raises HDL-C by 15 to 30 percent) failed to reduce cardiovascular events in the AIM-HIGH and HPS2-THRIVE trials when added to statin therapy. CETP inhibitors (which raised HDL-C by 50 to 100 percent) similarly failed to reduce ??? and some actually increased ??? cardiovascular events in multiple large phase 3 trials. These failures suggest that HDL-C as a number is primarily a marker of metabolic health (physical activity, absence of insulin resistance, alcohol intake, genetics) rather than a directly modifiable therapeutic target. Very high HDL-C (>80 to 90 mg/dL) may paradoxically associate with increased cardiovascular risk, possibly due to dysfunctional HDL particle biology in certain genetic and metabolic states.
The practical implication: focus treatment on LDL-C reduction (proven to reduce events) rather than HDL-C elevation (unproven). Lifestyle measures that raise HDL ??? regular aerobic exercise (raises HDL-C 5 to 10 percent), smoking cessation, alcohol moderation, weight loss ??? have multiple cardiovascular benefits beyond their HDL effect and are always recommended, but not because of the HDL-C number specifically.
Triglycerides ??? The Often Underappreciated Cardiovascular Risk Marker
Triglycerides are lipid molecules consisting of three fatty acids attached to a glycerol backbone ??? the primary storage form of fat in the body and the predominant lipid in dietary fat. Blood triglyceride concentration reflects a combination of endogenous hepatic VLDL synthesis (driven by carbohydrate and alcohol intake, insulin resistance, and genetic factors) and exogenous dietary fat absorbed as chylomicrons. Because chylomicron clearance takes 6 to 8 hours after a meal, triglycerides must be measured in the fasting state for accurate baseline assessment.
Severe hypertriglyceridemia (???500 mg/dL) is primarily managed to prevent acute pancreatitis ??? a potentially life-threatening complication ??? rather than for cardiovascular risk reduction. Dietary fat restriction (fat provides triglycerides directly as chylomicrons), carbohydrate restriction (carbohydrates stimulate hepatic VLDL synthesis), alcohol abstinence, and fibrate therapy (gemfibrozil or fenofibrate ??? reduce hepatic TG synthesis and increase LPL-mediated TG clearance) are the primary treatments for severe hypertriglyceridemia. In the extreme range (TG >1000 to 2000 mg/dL), hospitalization for IV insulin infusion and fat-free diet may be required to rapidly lower triglycerides and abort pancreatitis risk.
Non-HDL Cholesterol ??? A Better Number Than LDL Alone in Many Patients
Non-HDL cholesterol is simply total cholesterol minus HDL cholesterol (Non-HDL-C = TC ??? HDL-C). It represents the cholesterol content of all atherogenic lipoprotein particles ??? LDL, VLDL, IDL, and Lp(a) ??? in a single number that does not require fasting and does not require triglyceride measurement for calculation. Non-HDL cholesterol is increasingly recognized as a superior cardiovascular risk marker compared to LDL-C alone, particularly in patients with elevated triglycerides or metabolic syndrome:
In patients with triglycerides above 200 mg/dL, elevated VLDL remnant particles (IDL, VLDL remnants) carry substantial atherogenic risk that is invisible to the Friedewald LDL-C calculation. These patients may have a calculated LDL-C that appears adequately treated while their non-HDL-C remains substantially elevated ??? indicating residual atherogenic burden from VLDL remnants. Non-HDL-C captures this residual risk because it includes VLDL-C in its calculation. Epidemiologically, non-HDL-C is a stronger predictor of cardiovascular events than LDL-C in several large prospective studies, particularly in women and in patients with insulin resistance.
Non-HDL-C targets are set 30 mg/dL above the corresponding LDL-C target: a patient with a very high-risk LDL-C target of <70 mg/dL should have a non-HDL-C target of <100 mg/dL. Patients who meet their LDL-C target but not their non-HDL-C target have residual atherogenic risk from VLDL remnants ??? this residual risk may be addressed by triglyceride-lowering therapy (fibrates, omega-3 fatty acids ??? though the evidence for cardiovascular event reduction with these agents is mixed) or intensified lifestyle modification.
What to Expect When Your Lipid Panel Is Abnormal ??? The Step-by-Step Response
Many patients receive an abnormal lipid panel result and are uncertain what happens next. The typical clinical pathway after an abnormal lipid panel:
Step 1 ??? Confirm the result: A single abnormal lipid panel is not sufficient basis for lifetime statin therapy ??? results should be confirmed on a second fasting specimen, ideally 1 to 8 weeks later under similar dietary conditions, unless values are dramatically elevated (LDL-C ???190 mg/dL, TG ???500 mg/dL) or the patient has established cardiovascular disease requiring immediate treatment.
Step 2 ??? Identify secondary causes: Before attributing dyslipidemia to primary (genetic/lifestyle) causes, secondary causes that produce elevated LDL, triglycerides, or reduced HDL should be excluded: hypothyroidism (elevated TSH ??? elevated LDL), nephrotic syndrome (protein loss ??? liver upregulates all lipoprotein synthesis including LDL), chronic kidney disease (impaired lipoprotein clearance), poorly controlled diabetes (elevated TG, reduced HDL), obesity and metabolic syndrome (elevated TG, reduced HDL, elevated small dense LDL), and medications (corticosteroids, thiazide diuretics, beta-blockers, antiretroviral therapy ??? all raise LDL or TG). Treating the underlying secondary cause may normalize or improve the lipid panel without specific lipid-lowering therapy.
Step 3 ??? Calculate 10-year cardiovascular risk: The decision to initiate statin therapy is based not on the lipid value alone but on the overall cardiovascular risk. The ACC/AHA Pooled Cohort Equations (PCE) calculator uses LDL-C, HDL-C, systolic blood pressure, diabetes status, smoking, race, and age to estimate 10-year ASCVD risk. This risk score ??? combined with the LDL-C level, risk-enhancing factors (family history, CRP, CAC score, Lp(a)), and patient preferences ??? guides the shared decision-making conversation about statin initiation.
Step 4 ??? Lifestyle modification for 3 months (if appropriate): For patients with borderline-to-intermediate risk and LDL-C 70 to 189 mg/dL, a 3-month trial of dietary modification (reduced saturated fat, reduced refined carbohydrates, increased soluble fiber ??? psyllium, oat bran, legumes ??? and plant sterols) and aerobic exercise may reduce LDL-C by 10 to 20 percent ??? a meaningful reduction that may bring some patients to their target without medication. For high-risk or very high-risk patients, lifestyle optimization accompanies (rather than replaces) statin therapy from the start.
See our related articles on blood tests for heart health, cholesterol and heart attack risk, coronary calcium score, major risk factors for heart disease, and LDL vs HDL cholesterol. The American Heart Association cholesterol guide, NHLBI cholesterol overview, and ACC/AHA 2018 cholesterol guidelines provide authoritative clinical standards.
- Grundy SM, et al. 2018 AHA/ACC/AACVPR/AAPA/ABC/ACPM/ADA/AGS/APhA/ASPC/NLA/PCNA Guideline on the Management of Blood Cholesterol. J Am Coll Cardiol. 2019;73(24):e285-e350.
- Cholesterol Treatment Trialists Collaboration. Efficacy and safety of more intensive lowering of LDL cholesterol: a meta-analysis of data from 170,000 participants in 26 randomised trials. Lancet. 2010;376(9753):1670-1681.
- Lloyd-Jones DM, et al. 2022 ACC Expert Consensus Decision Pathway on the Role of Nonstatin Therapies for LDL-Cholesterol Lowering. J Am Coll Cardiol. 2022;80(14):1366-1418.
- Martin SS, et al. Comparison of a Novel Method vs the Friedewald Equation for Estimating Low-Density Lipoprotein Cholesterol Levels. JAMA. 2013;310(19):2061-2068.
- Nordestgaard BG, et al. Familial hypercholesterolaemia is underdiagnosed and undertreated in the general population. Eur Heart J. 2013;34(45):3478-3490.
Familial Hypercholesterolemia ??? When High LDL Is Genetic
Familial hypercholesterolemia (FH) is the most common serious genetic lipid disorder ??? present in approximately 1 in 250 adults in most populations, yet diagnosed in fewer than 10 percent of affected individuals. FH is caused by mutations in the LDL receptor gene (LDLR), the apolipoprotein B gene (APOB), or gain-of-function mutations in PCSK9 ??? all of which result in impaired clearance of LDL particles from the blood, producing substantially elevated LDL-C from birth throughout life.
Heterozygous FH (one mutated copy of LDLR ??? the most common form) typically produces LDL-C of 190 to 400 mg/dL. Homozygous FH (two mutated copies ??? rare, approximately 1 in 300,000) produces LDL-C of 500 to 1000 mg/dL and causes severe atherosclerosis in childhood, with MI and death often occurring before age 30 without aggressive intervention. The hallmark physical findings of FH ??? tendon xanthomas (cholesterol deposits in the Achilles tendon and extensor tendons of the hands), corneal arcus (gray-white ring at the periphery of the cornea) in patients under 45, and xanthelasma (cholesterol deposits around the eyelids) ??? are diagnostically useful when present but absent in many FH patients, particularly younger patients before deposits accumulate.
FH is diagnosed using the Dutch Lipid Clinic Criteria, which combines LDL-C level (score points for LDL-C 190 to 249, 250 to 329, or ???330 mg/dL), family history (first-degree relative with premature ASCVD before age 55 in men or 65 in women, or first-degree relative with known FH), personal history of premature ASCVD, physical findings (tendon xanthomas), and genetic testing. A total Dutch Criteria score of ???8 is “definite FH”; 6 to 7 is “probable FH”; 3 to 5 is “possible FH.” Genetic testing confirming a pathogenic LDLR, APOB, or PCSK9 variant is diagnostic regardless of score.
Treatment of FH requires high-intensity statin therapy from the time of diagnosis ??? age of diagnosis affects the lifetime cardiovascular risk reduction achievable. Adults with FH diagnosed at age 30 who achieve LDL-C below 100 mg/dL with statin therapy have near-normal cardiovascular event rates ??? demonstrating the power of early, sustained LDL-C reduction to offset decades of genetic LDL burden. Many FH patients require statin plus ezetimibe and/or PCSK9 inhibitor to reach guideline LDL-C targets. Children with FH should begin statin therapy at age 8 to 10 ??? the earlier the exposure is countered, the lower the lifetime cardiovascular risk.
Lipid Panel Monitoring ??? How Often and When to Recheck
Understanding the appropriate frequency of lipid panel monitoring prevents both under-testing (missing lipid changes that require treatment adjustment) and over-testing (unnecessary repeated panels in stable patients on effective therapy):
Initial lipid panel: Recommended by age 35 in men and age 45 in women without known risk factors, and earlier (age 20 to 35) if there is a family history of premature cardiovascular disease, diabetes, hypertension, obesity, or other risk factors. Universal screening at age 9 to 11 and again at age 17 to 21 (pediatric universal screening) is recommended by the National Heart, Lung, and Blood Institute to detect FH in childhood.
When not on lipid-lowering therapy: Repeat fasting lipid panel every 4 to 6 years if results are consistently in the low-to-desirable range and no significant risk factor changes occur. Repeat sooner (1 to 2 years) if results are borderline elevated, a new risk factor develops (new diabetes diagnosis, new hypertension, weight gain, smoking initiation), or a first-degree relative is diagnosed with premature ASCVD or FH.
After starting or changing statin therapy: Repeat fasting lipid panel at 4 to 12 weeks after initiation or dose change to verify the LDL-C response and assess for adverse effects. Once stable at target, annual lipid panel monitoring is sufficient for most patients ??? more frequent testing is not necessary and does not improve outcomes in stable, adherent patients on effective doses.
Adding non-statin therapy: When ezetimibe or a PCSK9 inhibitor is added due to insufficient LDL-C response to statin alone, recheck the lipid panel at 4 to 12 weeks after addition to verify additive LDL-C reduction (expected: ezetimibe adds 18 to 25 percent LDL-C reduction; PCSK9 inhibitors add 50 to 60 percent additional reduction beyond statin).
Common Lipid Panel Questions ??? Answered Directly
Can I eat before a lipid panel? For initial screening, yes ??? a non-fasting lipid panel is acceptable for total cholesterol, HDL, and non-HDL assessment. For accurate LDL-C calculation (especially important in patients with triglycerides above 200 mg/dL), monitoring statin response, or evaluating triglyceride levels accurately, fast for 9 to 12 hours (water is permitted).
Does exercise before the blood draw affect results? Vigorous exercise within 12 to 24 hours of the blood draw can transiently reduce triglycerides and modestly alter LDL-C. For the most reproducible results ??? particularly for serial monitoring ??? schedule the blood draw under consistent conditions: similar dietary intake the day before, similar activity level, similar time of day.
Why did my cholesterol go up after starting a statin? This is usually not true ??? statins reliably lower LDL-C by 30 to 50 percent (moderate-intensity statins) or 50 to 60 percent (high-intensity statins like rosuvastatin 20 to 40 mg or atorvastatin 40 to 80 mg). If LDL-C appears to rise after statin initiation, the most common explanations are: medication non-adherence (skipped doses), dietary changes (increased saturated fat intake), weight gain, development of hypothyroidism or diabetes, or laboratory variability between specimens. A fasting repeat panel drawn after 4 to 8 weeks of consistent daily statin use provides the reliable post-treatment comparison.
Is a total cholesterol of 200 mg/dL “normal”? Total cholesterol alone is a poor risk stratification tool because it does not distinguish between HDL-C (protective) and LDL-C (atherogenic). A total cholesterol of 200 mg/dL with HDL-C of 70 mg/dL and LDL-C of 100 mg/dL represents a favorable lipid profile; the same total cholesterol with HDL-C of 30 mg/dL and LDL-C of 150 mg/dL represents substantially higher atherogenic risk. Total cholesterol thresholds (<200 desirable, 200 to 239 borderline, ???240 high) are useful for initial population screening but should never be the sole basis for treatment decisions in an individual patient.
My LDL is at target but my doctor wants to add another medication ??? why? Residual cardiovascular risk ??? the risk that persists even with LDL-C at guideline targets ??? is driven by factors the lipid panel does not fully capture: elevated Lp(a), elevated hsCRP (inflammation), elevated non-HDL-C from VLDL remnants, elevated ApoB from small dense LDL particles, and the total burden of cardiovascular risk factors. Adding ezetimibe or a PCSK9 inhibitor to drive LDL-C even lower (below 55 mg/dL in very high-risk patients) may further reduce residual risk ??? a decision based on the individual patient’s risk profile, prior cardiovascular events, and tolerability, not on the lipid panel number alone.
My cardiologist recommended I look into lipid panel explained: what each number and this article covered it perfectly. I appreciated how the article addressed both the clinical side and the practical lifestyle adjustments. Appreciate the effort that went into researching and writing this — it shows.
Thank you for covering lipid panel explained: what each number so thoroughly without being overly technical. The article answered questions I didn’t even know I had until I started reading. Exactly the kind of evidence-based information that is hard to find in one place.
Finally a resource that explains lipid panel explained: what each number in plain language. The article answered questions I didn’t even know I had until I started reading. Exactly the kind of evidence-based information that is hard to find in one place.
This breakdown of lipid panel explained: what each number is exactly what patients need before a specialist appointment. The article answered questions I didn’t even know I had until I started reading. This is exactly why I prefer this website over generic health platforms.
I never fully understood lipid panel explained: what each number until I read this. The practical tips made this immediately actionable, not just theoretical. Appreciate the effort that went into researching and writing this — it shows.
Thank you for covering lipid panel explained: what each number so thoroughly without being overly technical. I especially valued the explanation of why these recommendations exist, not just what they are. This is going into my health folder that I bring to every doctor’s visit.